1.
Introduction ^
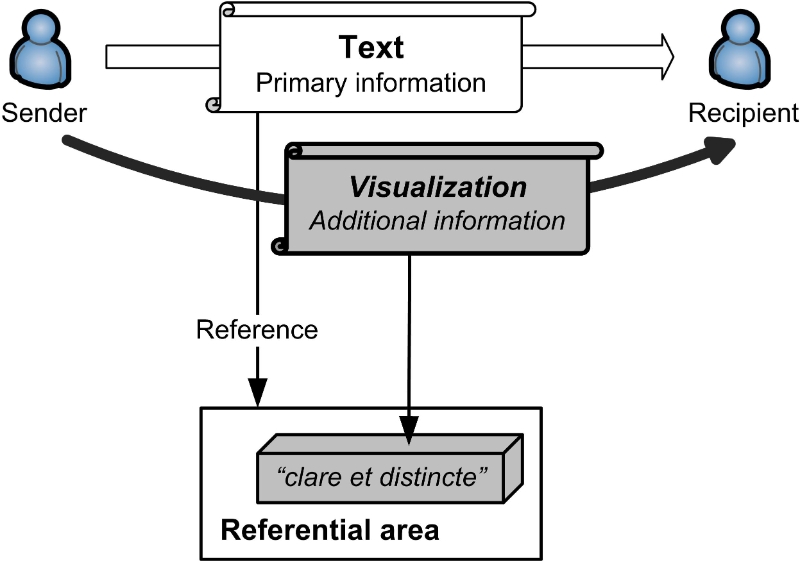
Figure 1: Communication from a sender to a non-technical recipient. «Clare et distincte», «clear and distinct», refers to René Descartes’s criterion of truth. Visualizations make the text easier to understand
2.
Repertoire in Lettering ^
We carry out an empirical study of the usage of textual labels. We further survey selected pictures from JURIX 2012 and JURIX 20132 papers. Previously, in [Čyras & Lachmayer 2015], the structural elements of the diagrams were discussed, such as colors, dimensions, focus, mindmapping, mixed shapes, quantity, relationships, tables, traditional diagrams with predefined semantics, such as argument graphs, and vertical and horizontal axes. Currently, we systematically discuss different text usage in the pictures. Basic graphical symbols, such as rectangles, ellipses, arrows, etc. allow lettering in the form of unformatted or formatted text (bold, italic, subscripts, various fonts, etc.). This applies to sub-elements and compositions, aggregations and layers. The repertoire of texts comprises different types: numbers, symbols, words, and sentences. Texts can be structured, e.g., 1:n, and can have various functions and semantics. Very different artifacts are represented in diagrams: argument graphs, inference graphs, judicial reasoning chains, work or knowledge flow diagrams, ontologies, system architectures, etc. We hold that it is important for a figure caption to name the artifact type clearly. The types of readers should be taken into account: jurists or engineers. Below, we list criteria for text analysis that may be very different:
- Formal signs. The names of laws and article numbers can be included in diagrams, see [Winkels & Hoekstra 2012, p. 160]. Thus, citations and references to laws can be included.
- Words. They usually label instances of a graphical symbol type. This is a usage in (semi)formal diagrams, such as the Aristotelian square of opposition and the deontic square [Philipps 2012, p. 70]. In this way, concepts and relations are labeled in ontologies [Poudyal & Quaresma 2012, p. 116]. Word combinations can be used in system architecture diagrams; see the architectural parts of the Argument Analysis System [Kubosawa et al. 2012, p. 62]. Different user roles are labeled textually in a use case diagram, which shows the Legilocal platform [Amardeilh et al. 2013, p. 12]. We find that normativity in system architecture diagrams is expressed as follows: a proposed architecture represents a norm To-Be (Norms To-Be and norms To-Do are distinguished [Sartor 2007, p. 446].) A diagram can show that a concept appears in documents and software applications of different levels [Winkels & Hoekstra 2012, p. 158]. A graph, which is syntactically simple (6 tasks, 7 knowledge assets and flow relations between them), but is not easy to understand semantically, is included in [Conetta & Schafer 2013, pp. 70–71]. Here, a directed graph represents the CommonKADS function structure for Transaction Configuration (TC). Knowledge flow between the decomposed tasks of the TC function is also explained in pseudo-code and text (the LKIF language, Legal Knowledge Interchange Format).
- Abbreviations. They shorten non-uniform wording and improve the readability of diagrams. For example, FA – factual assertion, LA – legal assertion, FLR – FA to LA rules, LA1 – «Hayashi is liable…», LA2 – «Hayashi is not liable…» in [Araszkiewicz & Šavelka 2012, p. 8]. Here, normativity is intrinsic in the whole paper, and their Figure 1 provides a condensed visualization, showing a constraint network in the Popov v. Hyashi case. Rectangles represent different types of elements, such as FAs, LAs, and rules. A chain of (bold, dashed) lines, each representing a constraint relation, models judicial reasoning in a coherence as constraint satisfaction (CaCS) framework. Other examples are defeat graphs [Prakken 2012, p. 128], where GCi and BCi abbreviate the i’th application of the argument scheme from good to bad consequences, respectively, in defeat graphs. A balance of abbreviations and their explanations should be achieved, because the meaning of abbreviations is not always understood from the first glance at a figure and its caption, and therefore, a reading of the whole article is required [Szőke et al. 2012, pp. 150–154].
- Symbols (textual). Greek letters, α, β,…, or capital letters, A, B (e.g., system A and system B), serve to label in different alphabets, see e.g., the argument analysis in [Kubosawa et al. 2012, p. 66]. In the modern language of science, algebraic symbols and letters with subscripts/superscripts have denoted abstract concepts since the time of Isaac Newton. Examples include inference graphs and argument graphs [Liang & Wei 2012, pp. 74, 79], strength diagrams for interacting parties [Pace & Schapachnik 2012, p. 111], and interacting legal specifications [Li et al. 2013, p. 111]. In argument component trees, where the issues, facts, and factors, and the relations between them, are made explicit, certain characters (∨ «or», ∧ «and») provide semantics to the tree nodes [Al-Abdulkarim et al. 2013, pp. 6, 8].
- Formulations. These are clauses of various lengths. They explain graphical symbols and contribute to an understanding of semantics. Examples include argument graphs and (mind)maps, such as classification maps (failure maps, damage maps, legal risk maps) and argumentation maps (legal analysis maps, legal design maps, insurance maps) [Contissa et al. 2013, p. 75]. Such maps present legal concepts and norms to lawyers and non-lawyers (engineers, software developers) within the cooperative design and assessment of new technologies for air traffic management. Formulations are also used in callouts [Kubosawa et al. 2012, p. 69].
- Sentences. They represent whole statements, which are longer than formulations. Examples include arguments in argument diagrams [Lynch et al. 2012, p. 84], [Prakken 2012, p. 127]. Statements with two outcomes, «yes» or «no», are used in decision flow diagrams [Kahlig 2008, p. 189]. Here, the statements are labeled with article numbers from the Austrian Act on Tenancy Law (Mietrechtsgesetz, MRG).
- Formatting. Different fonts, boldface, and white text in a black foreground serve to attract the reader’s attention properly and to focus it hierarchically [Buchanan et al. 2012, pp. 36, 38], where the architecture and the context are shown semi-formally. Formatting and the vertical/horizontal direction of the text conveniently structure the depicted artifacts, such as document models [Francesconi 2012, p. 47], where different shapes of different brightnesses are used.
- Structuring. Labels can be structured. There are examples of parameter = value lists in [Robaldo et al. 2012, pp. 137–139]. Such structural representations represent text as a graphical element.
- Numbering. This provides a sequence to interpret a diagram. Due to numbering, graphical workflow diagrams can be structured informally in a two-dimensional space [Conetta & Schafer 2013, p. 70; Governatori 2013, p. 78]. Thus, non-experts in graphical notations obtain freedom of expression.
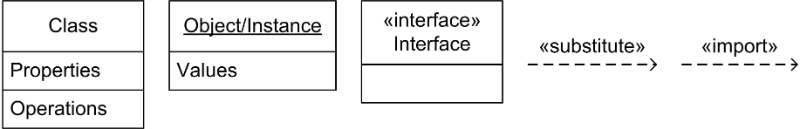
Figure 2: Textual differentiation: UML uses labels and typographical characteristics to distinguish between symbols (adapted from [Moody 2009, p. 764])
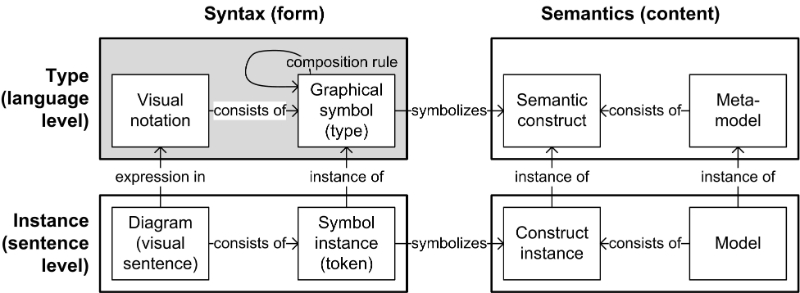
Figure 3: Language level and sentence level of visual notations (adapted from [Moody 2009, p. 757], where the focus is on the top left hand quadrant (visual syntax) and excludes semantic issues and sentence-level issues (bottom)
3.
Legal Visualization ^
4.
Legal Meanings – a Specific Feature of Legal Visualization ^
- Pointing function (e.g., an anatomy atlas)
- Situational function («A picture is worth a thousand words»)
- Construction (structure, design) function (the picture helps the viewer to build a mental model in her mind)
5.
Relations – the Core of Logical Pictures ^
We hold that a relation can be managed analogously to atomic entities. An entity–relationship model (ER model) refers to the techniques proposed in the seminal work of Peter P. Chen (1976).4 However, variants of the idea existed previously. Chen holds that «[t]he entity-relationship model adopts the more natural view that the real world consists of entities and relationships. It incorporates some of the important semantic information about the real world».
6.
Conclusions ^
7.
Acknowledgement ^
8.
References ^
Al-Abdukarim, Latifa; Atkinson, Katie; Bench-Capon, Trevor, From oral hearing to opinion in the U.S. Supreme Court. In: Ashley, Kevin D. (Ed.), Legal Knowledge and Information Systems, JURIX 2013: The Twenty-Sixth Annual Conference, IOS Press, Amsterdam, 1–10 (2013).
Amardeilh, F.; Bourcier, D.; Cherfi, H.; Dubail, C.-H.; Garnier, A.; Guillemin-Lanne, S.; Mimouni, N.; Nazarenko, A.; Paul, È.; Salotti, S.; Seizou, M.; Szulman, S.; Zagayouna, H., The Légilocal project: the local law simply shared. In: JURIX 2013, 11–14 (2013).
Araszkiewicz, Michał; Šavelka, Jaromir, Refined coherence as constraint satisfaction framework for representing judicial reasoning. In: Schäfer, Burkhard (Ed.) Legal Knowledge and Information Systems, JURIX 2012: The Twenty-Fifth Annual Conference, IOS Press, Amsterdam, 1–10 (2012).
Booch, Grady; Rumbaugh, James; Jacobson, Ivar, The Unified Modeling Language User Guide, 2nd edition, Addison-Wesley Professional (2005).
Buchanan, William; Fan, Lu; Lawson, Alistair; Schafer, Burkhard; Scott, Russell; Thuemmler, Christoph; Uthmani, Omair, Computational data protection law: trusting each other offline and online. In: JURIX 2012, 31–40 (2012).
Card, Stuart, Information visualization. In: Sears, Andrew; Jacko, Julie A. (Eds.), The Human-Computer Interaction Handbook, 2nd edition, Lawrence Erlbaum Associates, Taylor & Francis Group, New York, 509–543 (2008).
Chen, Peter P., The Entity-Relationship Model – toward a unified view of data. In: ACM Transactions on Database Systems 1(1):9–36 (1976).
Conetta, Orlando; Schafer, Burkhard, LKIF in commercial legal practice: transaction configuration from eurobonds to copyright. In: JURIX 2013, 63–72 (2013).
Contissa, Giuseppe; Laukyte, Migle; Sartor, Giovanni; Schebesta, Hanna, Assessing liability with argumentation maps: an application in aviation law. In: JURIX 2013, 73–76 (2013).
Čyras, Vytautas; Lachmayer, Friedrich, Towards multidimensional rule visualizations. In: Araszkiewicz, Michał et al. (Eds.), Problems of Normativity, Rules and Rule Following, Springer, 445–455 (2015).
Fill, Hans-Georg, Visualisation for Semantic Information Systems. Gabler, Wiesbaden (2009).
Francesconi, Enrico, Supporting transnational judicial procedures between European member states: the e-Codex project. In: JURIX 2012, 41–50 (2012).
Governatori, Guido; Lam, Ho-Pun; Rotolo, Antonino; Villata, Serena; Gandon, Fabien, Heuristics for licenses composition. In: JURIX 2013, 77–86 (2013).
Kahlig, Wolfgang, Modeling Law in e-Government: Case Examples for Legistic (Rechtsmodellierung im e-Government: Fallbeispiele zur Legistik), VDM Verlag Dr. Müller, Saarbrücken (in German) (2008).
Kubosawa, Shumpei; Lu, Youwei; Okada, Shogo; Nitta, Katsumi, Argument analysis with factor annotation tool. In: JURIX 2012, 61–70 (2012).
Li, Tingting; Balke, Tina; De Vos, Marina; Padget, Julian; Satoh, Ken, Legal conflict detection in legal systems. In: JURIX 2013, 107–116 (2013).
Liang, QingYin; Wei, Bin, An argumentation model of evidential reasoning with variable degrees of justification. In: JURIX 2012, 71–80 (2012).
Lynch, Collin; Ashley, Kevin; Falakmasir, Mohammad H., Comparing argument diagrams. In: JURIX 2012, 81–90 (2012).
Moody, Daniel L., The «physics» of notations: towards a scientific basis for constructing visual notations in software engineering. In: IEEE Transactions on Software Engineering, 35(5):756–778 (2009).
Pace, Gordon J.; Schapachnik, Fernando, Types in two-party systems: a formal analysis. In: JURIX 2012, 105–114 (2012).
Philipps, Lothar, On deontic squares – cubes – hypercubes (Von deontischen Quadraten – Kuben – Hyperkuben). In: Philipps, Lothar, Finite Legal Concepts with Infinite Limits: Essays on Legal Logic (Endliche Rechtsbegriffe mit unendlichen Grenzen: Rechtlogische Aufsätze), Anthologia, Editions Weblaw, Bern, 69–81 (in German) (2012).
Poudyal, Prakash; Quaresma, Paulo, An hybrid approach for legal information extraction. In: JURIX 2012, 115–118 (2012).
Prakken, Henry, Formalising a legal opinion on a legislative proposal in the ASPIC+ framework. In: JURIX 2012, 119–128 (2012).
Robaldo, Livio; Lesmo, Leonardo; Radicioni, Daniele P., Compiling regular expressions to extract legal modifications. In: JURIX 2012, 133–141 (2012).
Röhl, Klaus F.; Ulbrich, Stefan, Law Graphically. Visualization in the Education of Jurists (Recht anschaulich. Visualisierung in der Juristenausbildung), edition medienpraxis 3, Halem, Köln (in German) (2007).
Sartor, Giovanni, Legal Reasoning: A Cognitive Approach to the Law. A Treatise of Legal Philosophy and General Jurisprudence, vol. 5, Springer, Heidelberg (2007).
Szőke, Ákos; Förhécz, András; Strausz, György, A unified change management of regulations and their formal representations based on the FRBR framework and the direct method. In: JURIX 2012, 147–156 (2012).
Winkels, Radboud; Hoekstra, Rinke, Automatic extraction of legal concepts and definitions. In: JURIX 2012, 157–166 (2012).
Vytautas Čyras, Associate Professor, Vilnius University, Faculty of Mathematics and Informatics, Naugarduko 24, 03225 Vilnius, Lithuania, Vytautas.Cyras@mif.vu.lt; http://www.mif.vu.lt/~cyras/
Friedrich Lachmayer, Professor, University of Innsbruck, Innrain 47, 6020 Innsbruck, Austria, Friedrich.Lachmayer@uibk.ac.at; http://www.legalvisualization.com
Kristina Lapin, Associate Professor, Vilnius University, Faculty of Mathematics and Informatics, Naugarduko 24, 03225 Vilnius, Lithuania, Kristina.Lapin@mif.vu.lt; http://www.mif.vu.lt/~moroz/
- 1 http://jurix.nl/conferences/, accessed 7 January 2015.
- 2 JURIX 2012, the 25th International Conference on Legal Knowledge and Information Systems, http://justinian.leibnizcenter.org/jurix/, University of Amsterdam, 17–19 December 2012. JURIX 2013, http://sinatra.cirsfid.unibo.it/jurix2013/, University of Bologna, 11–13 December 2013 (accessed 7 January 2015).
- 3 The Unified Modeling Language (UML) is a general purpose modeling language in the field of software engineering, which is designed to provide a standard way to visualize the design of a system [Booch et al. 2005]. See also the webpage of Object Management Group, http://www.omg.org/spec/UML/, accessed 7 January 2015.
- 4 In software engineering, an entity–relationship model (ER model) is a data model for describing a database in an abstract way. Diagrams created to design the entities and relationships are called entity–relationship diagrams or ER diagrams (http://en.wikipedia.org/wiki/Entity%E2%80%93relationship_model, accessed 7 January 2015).


