Abbrevations:
CaRT (Classification and Regression Trees)
CIRI (Cingranelli & Richards HR database)
CoE (Council of Europe)
ECHR (European Convention of Human Rights)
ECtHR (European Court of Human Rights)
EU (European Union)
FN (Footnote)
HR (Human Rights)
ML (Maximum Likelihood)
PCA (Principal Component Analysis)
SW (Sex Work or Sex Worker)
TIPs (Trafficking In Persons)
UNO (United Nations Organization)
UK (United Kingdom)
US (United States)
USDS (US Department of State)
VP (human rights Violation Propensity)
JEL (Journal of Economic Literature) codes: K33, K42, I28, J88
1.
Introduction ^
Since forty years, political economy uses statistical methods to assess and compare HR fulfilment of countries.1 As outlined in a complementary paper,2 this empirical approach has brought far reaching and often controversial conclusions about the relevance of HR-treaties for actual HR protection. This paper contributes to the methodological debate about limitations of empirical approaches in comparative international law.
The first agenda of this paper is an analysis of the following aspects of this debate:
- First, country comparisons are based on reported HR violations, but what does this say about the actual HR situation? An evaluation of UN Human Rights Committee judgments led to the conclusion that empirical «HR measures were largely unrelated to [that committee’s] verdicts».3 Thus, there appears to be a discrepancy between HR violations that are just reported and HR violations that are proven by international jurisprudence. Can these different types of assessment be reconciled?
- Second, as HR violations are driven by societal problems, it is meaningful to consider HR in relation to specific problem fields. However, the assessment of the HR situation is based on comprehensive indices, such as CIRI (section 5). For such indices certain issues might eclipse all other HR related factors.4 Are they nevertheless capable of assessing or even explaining the HR problems of specific social groups?
- Third, in responding to the same societal problems, why do some countries respect HR, while others fail in often dramatic ways? Can HR respecting countries be distinguished from others by means of objective criteria? Here, the paper elaborates on the hypothesis of the corresponding paper (FN 2) that societal preferences of each country are root causes on the one hand of the country specific pattern of HR-related treaty ratifications, where states declare their societal preferences by the accession to treaties, and on the other of the country’s response to societal problems, including the level of HR protection.
The paper addresses these questions in a specific context.
- First, it focuses on Council of Europe (CoE) countries in order to reduce disparities between countries with different political systems (see the corresponding paper, FN 2).
- Second, within these countries the focus is on a «model population», (mainly) women in sex work (SW). There are three motives for this choice: A) As the corresponding paper explained (FN 2), SWs are a vulnerable group. In some countries there even exist «social attitudes [that] allow police a free hand for extortion, unlawful detention, and sexual abuse of women in prostitution».5 B) SWs are ubiquitous, with about 1.4% of adult women in the reproductive age.6 This amounts to 0.35% of the population (50% women and of them 50% in the reproductive age). Hence inferences can be drawn from reports about HR deficiencies as well as from the lack of such reports. C) However, the topic of SW was long ignored: Ten years ago it was too controversial for many authors, whence they did not document SWs’ rights abuses.7 In the meantime SW has become a focal issue in HIV prevention.8 UNAIDS promotes the insight that respect for HR of SWs is a key element of successful policies.9 Other organizations, e.g. ILO, confirm this.10
- Third, in order to identify societal preferences the paper focuses on the accession to twelve CoE conventions. Although the ratification to a single treaty may be uncorrelated to HR deficiencies, ratification patterns matter. Indeed, the paper identifies five types A to E with prognostic value for explaining the HR situation of SWs.
The second agenda of this paper is methodological and related to the overall topic of the 2014 issue of IRIS. It illustrates by means of an example (accessible to readers with a legal background) a rationale of indiscriminate data collection: Data mining may find surprising and useful structure in apparently unstructured data. This paper explores several routes to comparing countries and finding structure in ratification data that relates both to a country’s HR performance and its societal preferences.
2.
Materials and Methods of Data Analysis ^
The paper uses classification and regression trees (CaRT),11 first studied 30 years ago,12 as a novel method for studies in comparative international law. CaRT is a class of data mining methods to identify explanatory patterns in a way that resembles differential diagnostics in medicine. Actually, most applications of CaRT are in medical research, where CaRT is known to perform well, when compared to the more traditional regression models.13 Section S1 outlines the wide range of other applications, including US homeland security.
The present paper applies CaRT as a diagnostic tool for identifying country risks for certain societal failures. Specifically (first agenda), CaRT explains the HR situation of SWs. Section 4 maps it by an index SWDEF. (SWDEF for a country is 1/0, if there are some/are no reported serious HR problems related to SWs.) CaRT successively asks diagnostic questions. Such questions check thresholds for observed data (e.g. population size). Depending on the answer, this leads to the next diagnostic question, until finally the proposed diagnosis is SWDEF = 0 or SWDEF = 1. The paper applies chi-squared automatic interaction detection (CHAID).14 For this application, CaRT has the major advantage that it does neither make assumptions about underlying probability distributions, nor does it assume a parametric model to explain interactions. Instead, CaRT aims at the optimization of the information gain, measured here in terms of the reduction of the expected Shannon information entropy of the SWDEF = 0/1 data.15 (Authors subsequently simplified trees for the ease of presentation.) As for CaRT there is no generally accepted criterion for model selection, it is recommended to consider prediction errors (accepting some error to avoid over-fitting, where the model falsely «explains» even random variations) and judge, if the unveiled structure is reasonable and plausible.16 Simple models, which use few explanatory factors, are preferred.
SWDEF = 1 if vulnerability ≥ threshold, and SWDEF = 0, otherwise, where
vulnerability = weightsxCIRI and «x» is the scalar product of vectors.
Further, the paper defines a «probabilistically optimal» index, which needs not be feasible.19 Thereby, «probabilistically optimal» is defined with reference to a method of generalized regression analysis. (This type of analysis is common in comparative statistical HR studies; references in the introduction and the corresponding paper, FN 2.) Specifically, the paper applies censored Poisson regression.20 Poisson regression assumes that the number of reports about SW HR deficiencies follow a Poisson distribution, which is a familiar assumption for rare events. The parameters of the index are determined by the maximum likelihood (ML) method.
The analysis of ratification data uses another classical method of descriptive statistics, principal component analysis (PCA):21 Pictorially, data are perceived as a cloud, roughly of the form of a multi-dimensional ellipsoid; its axes are the principal components. In a similar context of country comparisons (fulfilment of HR in relation to achievement of Millennium Development Goals), PCA was used to better discriminate between countries.22
The paper applies also conventional methods, such as analysis of significant correlations or contingencies (T-test respectively x2-test/Fisher exact test with 95% significance).
3.
Data 1: Relevant European Treaties ^
4.
Data 2: HR Deficiencies in SW (SWDEF) ^
SWDEF is an HR-deficiency index about SWs’ HR situation in Europe: SWDEF of a country is 1, if there are verified reports, published between 2007 and 2012, about deficiencies affecting SWs. It is 0, otherwise. Table 5 summarizes it: Amongst 47 CoE countries authors could identify 13 countries with SWDEF = 0. Thereby reports/complaints were not counted: If each victim personally identified by a researcher (or court) counts as report, most reports are from Russia, with 30 victim respondents in an Open Society Foundation study.23 If SWDEF is to be refined by counting reports, then the more complex ILO methodology for case tracking and counting would be needed.24
- First, authors screened ECtHR judgments (HUDOC) for proven HR violations with a direct or indirect negative effect on SWs: Relevant violations were found for Bulgaria, Cyprus, Finland, Italy, Russia, Spain, Switzerland, and Turkey.
- Next, authors did a similar search for UN HR instruments, in particular concluding observations by treaty-based HR bodies about country reports (OHCHR homepage): Concerns about systematic deficiencies were noted for Albania, Austria, Germany, Ireland, Montenegro, and Ukraine.
- Third, authors screened USDS country reports: Concerns were voiced for Belgium, Bosnia & Herzegovina, Croatia, Georgia, Greece, Moldova, and Romania.
- Fourth, authors searched literature for documented HR violations (Google Scholar, Medscape, PubMed of NIH, or homepages of publishers, e.g. Elsevier, Sage etc.): Police misconduct (brutality, rape, extortion)25 or institutional deficiencies were reported e.g. from Armenia, Czech Republic, Latvia, Lithuania, Macedonia, Poland, Serbia, and Slovak Republic.
- Fifth, authors checked media (Google, Wikipedia) and NGO reports (e.g. Amnesty International). There are reports about HR-relevant incidents or deficiencies from Azerbaijan, Hungary, France, Sweden, and UK.
- The remaining 13 countries are classified as SWDEF = 0: Andorra, Denmark, Estonia, Iceland, Liechtenstein, Luxembourg, Malta, Monaco, Netherlands, Norway, Portugal, San Marino, and Slovenia. Thereby, as explained in Section S2, Estonia, Netherlands, and Norway are borderline cases for SWDEF = 0 and Finland for SWDEF = 1.
5.
Data 3: Other Country Data (VP, CIRI, etc.) ^
Table 5 informs about legal regulations of prostitution. The paper distinguishes prostitution laws and their implementation, based on the above mentioned sources for SWDEF. Authors used a standard classification of legal concepts:29 prohibitionist, abolitionist, neo-abolitionist («Swedish model»), or regulationist. Thereby, the assessments of this paper, e.g. of Finland as abolitionist, differs from other literature.30 Further, implementation of prostitution laws (even, if there are none) is conservative, if law enforcement actually restricts SW, and liberal otherwise.31 Thereby, a country was assessed as «liberal», if it was liberal for a significant time span during the observation period (Netherlands) or for a significant part of the country (Germany). Here, too, the present assessments may differ from literature. It would be expected that SWDEF depends on the type of prostitution laws. However, authors did neither observe a 95% significant correlation nor a significant contingency. Rather, implementation seems to matter: SWDEF is significantly correlated with implementation and for conservative countries (except Malta) SWDEF = 1, while for liberal prohibitionist countries SWDEF = 0 (with the exception of Slovenia all are microstates).
Proven HR violations are measured by the violation propensity (VP) of countries. It is the average annual rate of ECtHR judgments finding violations per million citizens. Data for population size uses UNO sources for 2010,32 data for judgments are from ECtHR,33 and the average is taken for each country between 2012 and the year, when the convention entered into force with respect to this country. VP ranges between 0.04 for Germany and 15.2 for San Marino, whereby for unknown reasons VP is generally higher for smaller countries.
For comprehensive indices of reported HR violations, the paper uses the Cingranelli & Richards HR database (CIRI).34 Since 1981 CIRI tracks the annual HR performance of 195 countries, based on Amnesty International Annual Reports and USDS Country Reports. It is currently the most influential dataset, used e.g. by World Bank in good governance assessments.35 In order to make CIRI comparable with SWDEF, the paper rescales CIRI linearly between 0 = no reports and 1 = maximal level of reported HR violations. Further, for each index the average over 2006 to 2010 is considered. Table S6 lists these average CIRI values for CoE.
6.
Results 1: Definition and Explanation of Ratification Types ^
Type A: Countries did not ratify all three data protection conventions (CETS 108, 181, 185) and did not ratify CETS 101, 125, or 064.
Type B: Countries ratified CETS 035, 101, 125 and at least one of CETS 100 or 064.
Type C: Countries ratified all three data protection conventions (CETS 108, 181, 185) plus CETS 157, but did not ratify CETS 048, 100, 101, or 064.Type D: Countries ratified CETS 048, but not CETS 035.
Type E: All other countries.
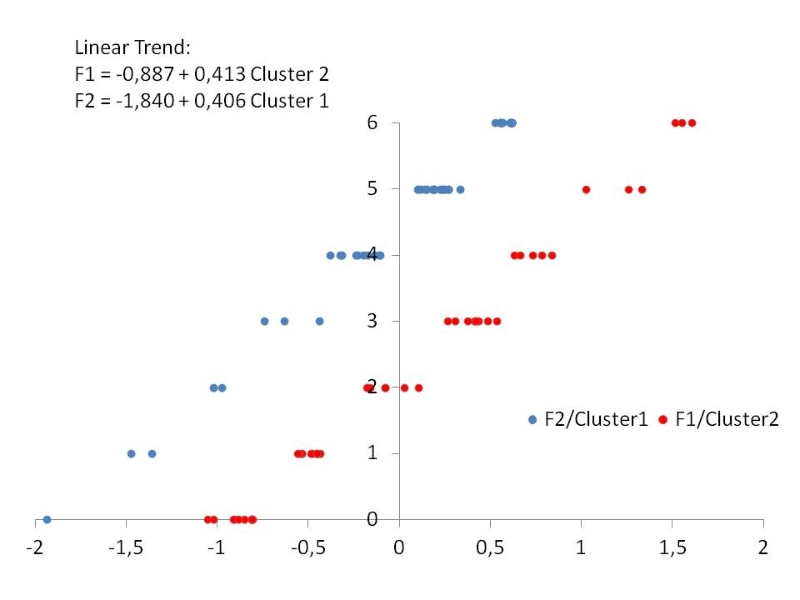
Figure 1. Number of ratifications in groups 1 or 2 as a function of F2 and F1
Table 1. Parameters a, b, c for the prediction of ratifications from the number of ratifications in groups 1 and 2, using the formula: ratification-entry = a + bxgroup-1-ratifications + cxgroup-2-ratifications, rounded to 0 or 1
| CETS 197 | CETS108 | CETS 181 | CETS 185 | CETS 148 | CETS 157 | |
| a | 0.130 | -0.046 | 0.159 | -0.147 | -0.250 | 0.168 |
| b | 0.139 | 0.189 | 0.140 | 0.183 | 0.153 | 0.171 |
| c | 0.014 | 0.060 | -0.042 | 0.029 | 0.040 | -0.052 |
| CETS 035 | CETS 048 | CETS 100 | CETS 101 | CETS 125 | CETS 064 | |
| a | 0.273 | 0.216 | -0.080 | -0.160 | 0.229 | -0.191 |
| b | -0.003 | -0.040 | -0.031 | 0.037 | -0.020 | 0.006 |
| c | 0.147 | 0.191 | 0.161 | 0.144 | 0.154 | 0.176 |
Explanation of the formula:
First, using the trend-lines in Figure 1, ratification counts in groups 1 and 2 define estimates for F1, F2. Next, the inverse of the coordinate transformation used for Table S4 (explanation there) is applied. Finally, the result is rounded to the next integer 0 or 1; it predicts approximately the treaty ratification status of a country.
- With the exception of Iceland (type E), countries are of type A, if F1 < 0.184, F2 < 0.038 and F12 ≥ –0.307.
- With the exception of Belgium (type E), countries are of type B, if F1 ≥ 0.932.
- Countries are of type C, if F1 < 0.184, F2 ≥ 0.038, F12 ≥ –0.307 and F7 ≥ –0.36.
- With the exception of Germany (type B), countries are of type D, if either F8 ≥ –0.599 and F6 < –0.546, or if F8 < –0.599.
- With the exception of Romania and Switzerland (type D), and missing Belgium and Moldova, countries are in type E, if either 0.184 ≤ F1 < 0.932 (11 of 15 type E countries) or if F1 < 0.184 and F6 ≥ 0.715.
7.
Results 2: Explaining SWDEF by Tree Models ^
- End-node 4 is classified as SWDEF = 0. For its 13 countries records in torture and assembly are amongst the best; 7 have a population below 1 million. Belgium and Finland (SWDEF = 1) are misclassified.42
- End-node 5 is pure, with SWDEF = 1. It consists of Croatia and Germany.
- End-node 6 is classified as SWDEF = 0. Cyprus is misclassified (SWDEF = 1).43
- End-node 7 is the largest node with 29 countries, whose records in torture and speech & press are amongst the worst in Europe. It is pure and classified as SWDEF = 1.

Figure 2. Classification tree to explain SWDEF in terms of CIRI (see Table 2)
Explanation: 47 Council of Europe countries in node 1 are split into 13 countries with SWDEF = 0 and 34 countries with SWDEF = 1. For 15 countries, CIRI index for torture is < 0.35, they are in node 2; the other are in node 3. Node 2 is further split according to index for assembly <0.3 or not. Node 3 is split according to index for speech & press <0.05 or not. Nodes 5 and 7 are pure (SWDEF = 1 for all 2 respectively 29 countries, grey colour). Nodes 4 and 6 are mixed, whereby predominantly SWDEF = 0 (white colour).
Table 2. Description of the classification tree of Figure 2
| node number | number of countries | % of all countries | prede-cessor node | suc-cessor node | decision-criterion | thres-hold | fore-cast for node | how often correct | % correct (purity) | decision rule |
| 1 | 47 | 100 | root node | 2; 3 | 1 | 34 | 72,3 | SWDEF = 1 with 72.3% probability | ||
| 2 | 15 | 31,9 | 1 | 4; 5 | Torture | <0.35 | 0 | 11 | 73,3 | If Torture <0,35, then SWDEF= 0 with 73,3% probability |
| 3 | 32 | 68,1 | 1 | 6; 7 | Torture | ≥0.35 | 1 | 30 | 93,8 | If Torture ≥0,35, then SWDEF = 1 with 93,8% probability |
| 4 | 13 | 27,7 | 2 | end node | Assembly | <0.3 | 0 | 11 | 84,6 | If Assembly <0.3 and Torture <0.35,then SWDEF = 0 with 84,6% probability |
| 5 | 2 | 4,3 | 2 | end node | Assembly | ≥0.3 | 1 | 2 | 100 | If Assembly ≥0.3 and Torture <0.35, then SWDEF = 1 with 100% probability |
| 6 | 3 | 6,4 | 3 | end node | Speech & Press | <0.05 | 0 | 2 | 66,7 | If Speech <0.05 and Torture ≥0.35, then SWDEF = 0 with 66,7% probability |
| 7 | 29 | 61,7 | 3 | end node | Speech & Press | ≥0.05 | 1 | 29 | 100 | If Speech ≥0.05 and Torture ≥0.35, then SWDEF = 1 with 100% probability |

Figure 3. Classification tree to explain SWDEF using ratification types (see Table 3)
Explanation: SWDEF = 1 for grey nodes; SWDEF = 0 for white nodes; other nodes transient.
Table 3. Description of the classification tree of Figure 3 (thresholds explained there; alternative description: Table S1)
| node number | number of countries | % of all countries | prede-cessor node | suc-cessor node | decision-criterion | thres-hold | fore-cast for node | how often correct | % correct (purity) | decision rule |
| 1 | 47 | 100.0 | root node | 2, 3, 4 | 1 | 34 | 72,3 | SWDEF = 1 with 72.3% probability | ||
| 2 | 12 | 25.5 | 1 | 5, 6 | population size | S | 0 | 9 | 75.0 | If pop = S, then SWDEF = 0 with 75% probability |
| 3 | 28 | 59.6 | 1 | 7, 8, 9 | population size | I | 1 | 24 | 85.7 | If pop = I, then SWDEF = 1 with 85.7% probability |
| 4 | 7 | 14.9 | 1 | end node | population size | H | 1 | 7 | 100.0 | If pop = H, then SWDEF = 1 with 100% probability |
| 5 | 9 | 19.1 | 2 | 10, 11 | violation propensity | H | 0 | 6 | 66.7 | If pop = S and VP = H, then SWDEF = 0 with 66.7% probability |
| 6 | 3 | 6.4 | 2 | end node | violation propensity | I, L | 0 | 3 | 100.0 | If pop = S and VP < H, then SWDEF = 0 with 100% probability |
| 7 | 9 | 19.1 | 3 | end node | violation propensity | H | 1 | 9 | 100.0 | If pop = I and VP = H, then SWDEF = 1 with 100% probability |
| 8 | 16 | 34.0 | 3 | 12, 13 | violation propensity | I | 1 | 15 | 93.8 | If pop = I and VP = I, then SWDEF = 1 with 93.8% probability |
| 9 | 3 | 6.4 | 3 | end node | violation propensity | L | 0 | 3 | 100.0 | If pop = I and VP = L, then SWDEF = 0 with 100% probability |
| 10 | 6 | 12.8 | 5 | end node | ratification type | A, B, D | 0 | 6 | 100.0 | If pop = S, VP = H, type = A, B, or D, then SWDEF = 0 with 100% probability |
| 11 | 3 | 6.4 | 5 | end node | ratification type | C, E | 1 | 3 | 100.0 | If pop = S, VP = H, type = C or E, then SWDEF = 1 with 100% probability |
| 12 | 15 | 31.9 | 8 | end node | ratification type | A, C, D, E | 1 | 15 | 100.0 | If pop = I, VP = I, and type is not B, then SWDEF = 1 with 100% probability |
| 13 | 1 | 2.1 | 8 | end node | ratification type | B | 0 | 1 | 100.0 | If pop = I, VP = I, and type = B, then SWDEF = 0 with 100% probability |
8.
Results 3: Explaining SWDEF by Indices of Vulnerability ^
The ML-model counts HR-deficiency reports for SW as a hidden variable, modelled by censored Poisson regression:
expected count of deficiency reports = E(def) = popx(ctype + kxVP)
Here, E(x) is expected value, def is the variable «deficiency report count» for each country, pop is its population size (in million people), ctype is a constant for the specific SW aversion in ratification type A to E, k is a constant of proportionality and VP measures ECHR fulfilment. This model postulates that the number of (reported) HR violations against SWs is proportional to population size. Assuming a roughly equal proportion of SWs across European countries (section 1), the factor of proportionality, E(def)/pop = ctype + kxVP, then quantifies HR mal-performance, as felt by individual SWs: It depends on the one hand on societal SW aversion ctype, and on the other on the overall HR situation VP; Table 5 displays it.
Model parameters are obtained by ML, assuming Poisson-distribution with mean x = E(def) for the number x of reports: probability for x reports = Poisson(x, x). Defining equations are:
«SWDEF = 0» (event x = 0): likelihood = Poisson(0, x) = exp(–x)
«SWDEF = 1» (event 0 < x < 51): likelihood = sum over n = 1 to 50 of Poisson(n, x)
The following indices of vulnerability (where vulnerability = weightsxCIRI is a weighted average of CIRI indices) have a different purpose: They aim at improving the Figure 2 tree model by using feasible indices:45 Countries with SWDEF = 0 could be distinguished without misclassification from those with SWDEF = 1 by a condition vulnerability ≥ threshold. One feasible index is special (parameters in Table 4, row #3; for other feasible indices: section S5). As explained in section 2, it maximally separates countries with SWDEF = 1 from those with SWDEF = 0.46 With the exception of judicial independence, it uses only criteria that need to have positive weights. Figure 5 plots the values of the vulnerability indices. Its second dimension is co-vulnerability, whose weights (Table 4, row #4) maximize the correlation coefficient (0.9) with vulnerability, subject to the condition that no criteria are used that were used to define vulnerability. For 21 countries (62% of SWDEF = 1 countries), co-vulnerability exceeds 0.085, while co-vulnerability of all countries with SWDEF = 0 is below this threshold. Hence, also the criteria used in co-vulnerability may explain SWDEF.
Table 4. Examples of feasible criteria weights: SWDEF = 1, if and only if vulnerability ≥ threshold
| Num-ber | thres-hold | Dis-ap-pear-ance | ex-tra-judi-cial kil-ling | poli-tical pri-so-ner | Tor-ture | assem-bly | move in / out coun-ty | move within coun-try | speech & press | free elec-tion | reli-gion | worker: rights | women: eco-nomic rights | women: poli-tical rights | inde-pen-dent judi-ciary |
| #1 | >0 | 0 | 0 | >0 | >0 | 0 | 0 | 0 | >0 | 0 | >0 | 0 | 0 | 0 | 0 |
| #2 | 0.17 | 1 | 0.27 | 0.39 | 0.32 | 0.27 | 1 | 1 | 0.2 | 0.11 | 0.5 | 0.1 | 0.1 | 0.09 | 0.63 |
| #3 | 0.15 | 0 | 0 | 0.32 | 0.28 | 0 | 0 | 0 | 0.06 | 0 | 0.34 | 0 | 0 | 0 | 0.01 |
| #4 | na | 0 | 0.45 | 0 | 0 | 0.1 | 0.14 | 0.17 | 0 | 0.03 | 0 | 0.01 | 0.09 | 0 | 0 |
| #5 | 0.15 | 0 | 0 | 0.3 | 0.3 | 0 | 0 | 0 | 0.18 | 0 | 0.22 | 0 | 0 | 0 | 0 |
| #6 | 0.11 | 0 | 0 | 0.21 | 0.19 | 0 | 0 | 0 | 0.04 | 0 | 0.23 | 0 | 0 | 0 | 0.34 |
Explanation: Numbers are rounded to two decimals. Row #1 explains, if the minimal weight 0 can be attained, row #2 gives upper bounds for the weights and the threshold (not attained), #3 displays the parameters for the index of vulnerability used in Figure 4, #4 is a corresponding index of co-vulnerability, and #5, #6 are explained in Section S5.
9.
Discussion of CIRI Models ^
- As the tree model demonstrates, a high level of torture predicts for 94% of countries SWDEF = 1, whereas a low level predicts for 73% of countries SWDEF = 0. This is plausible: Where police brutality is common, SWs inevitably suffer from it, as police is responsible for the enforcement of prostitution laws, irrespective of their content (no significant correlation of SWDEF with legal regulations).
- For countries with lower levels of torture, the tree model branches by assembly. There is a significant correlation of SWDEF with assembly, as of 23 countries with problems, SWDEF = 0 for Estonia and Liechtenstein, only. Lacking tolerance, which causes problems with assembly, may also cause reactions to the visibility of SWs at public places, e.g. police interventions against street prostitution. This in turn increases the risk of abuse, even if the general level of police brutality is lower.
- For countries with higher levels of torture, the tree model predicts that high respect for speech & press could check police brutality: SWDEF = 0 for 66% of such countries, and SWDEF = 1 for 100% of all other countries. Indices of vulnerability complement this: If there are sufficiently strong violations of both torture and speech & press, then this alone suffices for SWDEF = 1 (Table 4, row #5). The importance of speech & press becomes plausible under the aspect that systematic deficiencies could be remedied by political decisions, but without an open public discourse policy makers may not even know that there is a HR problem about SWs.
- The criterion «political prisoners» is needed to correctly classify Finland in terms of vulnerability. However, there is neither a significant correlation with SWDEF, nor did any reported deficiency concern political persecution of SWs. The tree model, which does not aim at perfect representation of SWDEF, is free of this peculiarity.47
- For religion a causal link with SWDEF is plausible: In conservative societies concerns about an alleged display of immorality may cause intolerance against visibility of SWs, which the tree model describes through assembly. There is a significant correlation with SWDEF: Of 29 countries with problems about religion, SWDEF = 1 for all, except two.48
- First, in countries with a generally good HR situation, HR of SWs may be respected. In terms of the models, these are countries in node 4 (not pure) with low vulnerabilities (torture < 0.35, assembly < 0.3, vulnerability < 0.14, co-vulnerability < 0.085), namely 11 European and 5 other countries: Australia, Marshall Islands, Nauru, New Zealand, and Palau; all with SWDEF = 0 (Section S3). This confirms the same model prediction with 98% significance.51
- Second, in countries with a generally poor HR situation, where e.g. police brutality is common, SWs are expected to suffer from police misconduct. In terms of the tree model, this is node 7 (torture > 0.35, speech & press > 0.05) with 29 European (SWDEF = 1) and 111 countries of other parts of the world. Best candidates for a refutation of the forecast SWDEF = 1 would be node 7 countries with low co-vulnerability < 0.085, namely 13 European and 4 other countries: Antigua & Barbuda, Barbados, Cap Verde, and Mauritius; all with SWDEF = 1 (Section S3). At the worst end, there are 3 countries in node 7 with vulnerability = 1 and co-vulnerability > 0.9; for them SWDEF = 1, too (Section S3): China, Iran, and Northern Korea.52

Figure 4. Country plot of vulnerability and co-vulnerability in the world and of SWDEF in CoE
Explanation: Vulnerability is a weighted mean of CIRI indices political prisoners, torture, speech & press, religion, and independence of the judiciary; the weights (Table 4, row #3) maximize the distance between SWDEF = 0 (country positions plotted as «x») and SWDEF = 1 (plotted as «+»). Co-vulnerability is a weighted mean of CIRI indices extrajudicial killing, assembly, move international, move domestic, election, workers» rights, and women’s economic rights; the weights maximize correlation with vulnerability (Table 4, row #4) for CoE countries. For countries not in CoE (plotted as «x») SWDEF is not evaluated. Thereby, due to lacking data, the Kosovo, Somalia and Vatican (Holy See) was not considered. For the USA «religion» was missing in 2006 and for Sierra Leone, «political prisoners» was missing in 2009; in both cases the same value was inserted, as in all other years. During the considered period, Sudan was still united.
10.
Discussion of Ratification-Type Models ^
The following observations corroborate the relevance of ratification types:
- The ML-model computes for each country the probabilities for SWDEF = 1, which may be interpreted as forecasts, based on the prolongation of present policies. The following corroborates these ML-model predictions: Amongst Baltic countries, the model predicts lowest probability for SWDEF = 1 in Estonia (22%) and highest probability for Lithuania (96%), followed by Latvia (89%). The same ranking (not used in the present assessment) was observed previously:53 46% of 158 SWs in Estonia reported sexual violence by clients and police, but 98% of 154 SWs in Lithuania and 86% of 162 SWs in Latvia.
- Both ratification models confirm each other with respect to the following conclusion: If societal preferences on SW-aversion are related to ratification types, then that aversion is higher for type C, than for type B, while the other types are in between. For the Figure 3 model, this follows from the level-3 end-nodes: SWDEF = 0 in end-node 13 with a type-B country; SWDEF = 1 in end-nodes 11 and 12 with type-C countries. Further, Table S1 illustrates that only Germany and Italy are type-B countries with SWDEF = 1; there population size explains deficiency reports. For the ML-model, E(def)/pop is lowest (best) for all type-B countries and highest for all type-C countries; types A, D, E are in between.
- Therefore, with respect to E(def)/pop of the ML-model, the five worst SW destinations are type-C countries with high VP:54 Bulgaria (maximal), Croatia, Latvia, Macedonia and the Slovak Republic. The latter countries, except Croatia, were studied by Open Society Foundation (FN 23) and the stunning reports of lawlessness confirm the model prediction about a high rate of problems, although the country classifications for SWDEF used as input only the existence of certain problems, not their endemic character.
- There are also geographical similarities of type-C countries: 73% are situated along river Danube drainage basin. Across these countries deficiencies related to independence of the judiciary were observed, though not used as input for SWDEF.55 SWDEF is correlated to the judiciary-CIRI-index.
- For tier-1 countries E(def)/pop is stochastically lower than for tier-2 countries (Mann-Whitney-Wilcoxon test), which is as expected, because SWDEF is related to trafficking. However, the tier-classification was not used as input for these models or the country assessments for SWDEF.
In addition to these empirical checks, the models were tested by simulations:
- A key issue for CaRT is the potential loss of information by over-fit: If all countries were in singleton nodes (consisting of one country only), then all nodes would be pure and the model would correctly «predict» all outcomes, even from a random distribution. The tree of Figure 3 has only one singleton node (#13: Portugal), but there may be «hidden» singletons: The paper therefore considers the maximally split model, where the maximal split of nodes is achieved by defining a class for each possible combination of parameter values.56 In this maximally split model, 13 countries are in singleton nodes. Thus, the remaining 72% of countries (34 countries) are not singletons; for them there is no over-fit.
- A random shuffle (permutation) of the 34 SWDEF = 1 and 13 SWDEF = 0 classifications amongst 47 countries indicates that even for the maximally split model (where within a class, majority decides assessment) 99% of shuffles result in four or more misclassifications and an information gain of less than 69%. Comparing this with the performance of the Figure 3 model, it follows (99% significance) that deficiencies are not randomly distributed over countries. Instead there is a non-trivial link of SWDEF with country size, VP and ratification types.
- More specifically, ratification types matter. For, if only countries with the same types of county size and VP are shuffled, then in the maximally split model 95% of shuffles result in two or more misclassifications and for 99% of shuffles information gain is below 91%.
- If the probabilities for SWDEF = 1 predicted by the ML-model are used to assess the risk for yet undetected additional deficiencies, then (using simulations) with 95% confidence there remain at least eight countries (62% of 13 countries) with SWDEF = 0. Considering such additional deficiencies, with 95% confidence the tree of Figure 3 would generate at most three misclassifications. Similarly, for the maximally split model information gain would be at least 84% and there would be at most two misclassifications. In order to falsify the maximally split model with additional deficiencies, the focus would be on Norway (46% chance of misclassification), Malta (12%) and the Netherlands (5%).57
- For the ML-model, the probabilities for SWDEF = 1 were used for two types of simulations, namely A) randomly changing SWDEF only for countries with SWDEF = 0 to allow for additional deficiencies, and B) changing SWDEF-values for all countries. Parameters k and ctype were obtained from ML estimation under the condition that they are non-negative. These simulations result in different country ranking by E(def)/pop, but confirm the conclusion that type B is rather beneficial for SWs’ HR, while type C is not.
- Pair-wise comparisons of the simulated maximum-likelihood parameters ctype for each simulation (matched samples) indicate in each of the above cases A and B that at least three groups of countries need to be distinguished: Parameters ctype for types B and C are significantly different from all other types, but the remaining types A, D, E may have equal parameters.58 Thus, the ML-model confirms the need to distinguish at least three country types.
11.
Conclusion ^
- The tree model of Figure 3 and the ML-model of section 8 utilize the obvious causal relationship that the number of incidents, therefore the number of reported deficiencies, is proportional to the size of the population of a country, whereby (ML-model) the constant of proportionality may depend on the country.
- The tree model of Figure 2 and the feasible index of vulnerability of section 7 point out the following causality: The SW population suffers from most HR problems that are endemic in a country. Thereby there is a strong link to torture, where lacking awareness for torture, as measured by CIRI, may be the root cause for SWDEF = 1. This reflects the focus of SWDEF on torturous treatment of SWs, such as legal obligations for SWs that could be discriminatory and potentially degrading (forced HIV tests or gynaecological inspections), administrative practices that might make SWs vulnerable to extortion and brutality by criminals (lacking protection against trafficking), or deficient prevention of police misconduct (brutality, rape, extortion).
- A similar conclusion with respect to VP is supported by the tree model of Figure 3 and the ML-model. Both models explain that the general HR situation VP matters for SWDEF, even though there is no significant correlation between VP and SWDEF (as population size may hide this effect).
- In addition, the ratification-type models indicate a relationship between the HR situation of SWs and the ratification of treaties. Here, the paper assumes causality, too, but further research is needed to confirm this hypothesis: It says that there are societal preferences, which become visible through ratification types, and which cause specific aversions against vulnerable groups. This may reinforce domestic authorities to act in a way that makes HR violations more likely. If this causality is accepted, then societal preferences of type C are key hindrances to better HR fulfilment. This would indicate that the improvement of SWs’ HR requires long-term measures, where countries promote more tolerance towards vulnerable populations and unconventional lifestyles. Considering the negligible information gain from prostitution laws about SWDEF, the authors expect that legal changes alone would influence the situation of SWs only marginally.
12.
Appendix: Summary Table ^
Table 5. Summary of results (country types, node affiliations, other index values)
| State | SWDEF | pop mill | legal | imple-ment | VP | ECHR Viola-tions | years in CoE | ratif. type | Figure 2 EN | Figure 3 EN | E(def) / pop | prob (%) of SWDEF =0 | vulner-ability | co-vulner-ability |
| Albania | 1 | 3.20 | P | C | 1.17 | 60 | 16 | C | 7 | 12 | 0.95 | 5 | 0.20 | 0.10 |
| Andorra | 0 | 0.09 | P | L | 1.47 | 2 | 16 | A | 4 | 10 | 0.29 | 98 | 0.00 | 0.06 |
| Armenia | 1 | 3.09 | P | C | 1.39 | 43 | 10 | C | 7 | 12 | 0.95 | 5 | 0.79 | 0.50 |
| Austria | 1 | 8.39 | R | C | 0.61 | 274 | 54 | C | 7 | 12 | 0.94 | 0 | 0.23 | 0.07 |
| Azerbaijan | 1 | 9.19 | P | C | 0.94 | 86 | 10 | E | 7 | 12 | 0.15 | 25 | 0.97 | 0.58 |
| Belgium | 1 | 10.71 | A | L | 0.28 | 169 | 57 | E | 4 | 12 | 0.14 | 22 | 0.16 | 0.04 |
| Bosnia | 1 | 3.76 | P | C | 0.77 | 29 | 10 | C | 7 | 12 | 0.94 | 3 | 0.39 | 0.22 |
| Bulgaria | 1 | 7.49 | A | C | 5.36 | 804 | 20 | C | 7 | 7 | 1.03 | 0 | 0.42 | 0.19 |
| Croatia | 1 | 4.40 | P | C | 3.50 | 231 | 15 | C | 5 | 7 | 1.00 | 1 | 0.16 | 0.12 |
| Cyprus | 1 | 1.10 | A | L | 1.40 | 77 | 50 | E | 6 | 11 | 0.16 | 84 | 0.24 | 0.08 |
| Czech Rep. | 1 | 10.49 | A | L | 1.01 | 201 | 19 | E | 7 | 12 | 0.15 | 20 | 0.16 | 0.09 |
| Denmark | 0 | 5.55 | A | L | 0.05 | 17 | 59 | B | 4 | 9 | 0.03 | 86 | 0.1 | 0.02 |
| Estonia | 0 | 1.34 | A | L | 1.31 | 28 | 16 | D | 6 | 6 | 0.18 | 78 | 0.14 | 0.07 |
| Finland | 1 | 5.37 | A | L | 1.25 | 147 | 22 | C | 4 | 12 | 0.95 | 0 | 0.16 | 0.02 |
| France | 1 | 62.79 | A | C | 0.31 | 741 | 38 | E | 7 | 4 | 0.14 | 0 | 0.33 | 0.08 |
| Georgia | 1 | 4.35 | P | C | 1.18 | 67 | 13 | A | 7 | 12 | 0.28 | 30 | 0.49 | 0.38 |
| Germany | 1 | 82.30 | R | L | 0.04 | 211 | 59 | B | 5 | 4 | 0.03 | 11 | 0.23 | 0.11 |
| Greece | 1 | 11.36 | R | C | 1.96 | 846 | 38 | E | 7 | 7 | 0.17 | 14 | 0.64 | 0.22 |
| Hungary | 1 | 9.98 | R | C | 1.23 | 246 | 20 | C | 7 | 12 | 0.95 | 0 | 0.23 | 0.07 |
| Iceland | 0 | 0.32 | N | L | 0.48 | 9 | 59 | E | 4 | 6 | 0.14 | 96 | 0.07 | 0.03 |
| Ireland | 1 | 4.47 | A | C | 0.10 | 27 | 59 | A | 7 | 12 | 0.26 | 32 | 0.25 | 0.02 |
| Italy | 1 | 60.55 | A | C | 0.59 | 2,030 | 57 | B | 7 | 4 | 0.04 | 10 | 0.40 | 0.12 |
| Latvia | 1 | 2.25 | R | C | 2.99 | 101 | 15 | C | 7 | 7 | 0.99 | 11 | 0.36 | 0.18 |
| Liechtenstein | 0 | 0.04 | P | L | 5.55 | 6 | 30 | A | 4 | 10 | 0.37 | 99 | 0.00 | 0.04 |
| Lithuania | 1 | 3.32 | P | C | 1.52 | 86 | 17 | C | 7 | 7 | 0.96 | 4 | 0.17 | 0.12 |
| Luxembourg | 0 | 0.51 | A | L | 1.30 | 39 | 59 | B | 4 | 6 | 0.05 | 97 | 0.00 | 0.01 |
| Macedonia | 1 | 2.06 | P | C | 2.82 | 87 | 15 | C | 7 | 11 | 0.98 | 13 | 0.46 | 0.09 |
| Malta | 0 | 0.42 | A | C | 2.35 | 44 | 45 | A | 4 | 10 | 0.30 | 88 | 0.11 | 0.02 |
| Moldova | 1 | 3.57 | P | C | 8.10 | 434 | 15 | E | 7 | 7 | 0.30 | 35 | 0.62 | 0.22 |
| Monaco | 0 | 0.04 | P | L | 4.04 | 1 | 7 | A | 4 | 10 | 0.34 | 99 | 0.02 | 0.04 |
| Montenegro | 1 | 0.63 | P | C | 2.11 | 8 | 6 | C | 7 | 11 | 0.97 | 54 | 0.23 | 0.08 |
| Netherlands | 0 | 16.61 | R | L | 0.09 | 91 | 58 | E | 4 | 9 | 0.14 | 10 | 0.14 | 0.02 |
| Norway | 0 | 4.88 | N | L | 0.07 | 21 | 59 | E | 4 | 9 | 0.14 | 51 | 0.03 | 0.01 |
| Poland | 1 | 38.28 | A | L | 1.33 | 968 | 19 | E | 7 | 12 | 0.16 | 0 | 0.20 | 0.08 |
| Portugal | 0 | 10.68 | A | L | 0.52 | 188 | 34 | B | 6 | 13 | 0.04 | 68 | 0.14 | 0.08 |
| Romania | 1 | 21.49 | P | C | 3.13 | 1,209 | 18 | D | 7 | 7 | 0.22 | 1 | 0.58 | 0.36 |
| Russia | 1 | 142.96 | P | C | 1.52 | 3,041 | 14 | A | 7 | 4 | 0.29 | 0 | 0.94 | 0.58 |
| San Marino | 0 | 0.03 | P | L | 15.18 | 11 | 23 | A | 4 | 10 | 0.56 | 98 | 0.00 | 0.00 |
| Serbia | 1 | 9.86 | P | C | 1.12 | 88 | 8 | C | 7 | 12 | 0.95 | 0 | 0.38 | 0.20 |
| Slovak Rep. | 1 | 5.46 | A | C | 2.80 | 291 | 19 | C | 7 | 7 | 0.98 | 0 | 0.34 | 0.08 |
| Slovenia | 0 | 2.03 | P | L | 12.07 | 441 | 18 | D | 4 | 10 | 0.40 | 45 | 0.10 | 0.04 |
| Spain | 1 | 46.08 | A | L | 0.05 | 68 | 33 | E | 7 | 4 | 0.14 | 0 | 0.49 | 0.04 |
| Sweden | 1 | 9.38 | N | L | 0.11 | 61 | 59 | E | 7 | 12 | 0.14 | 28 | 0.16 | 0.01 |
| Switzerland | 1 | 7.66 | R | C | 0.27 | 79 | 38 | D | 7 | 12 | 0.16 | 29 | 0.33 | 0.04 |
| Turkey | 1 | 72.75 | R | C | 0.88 | 3,692 | 58 | E | 7 | 4 | 0.15 | 0 | 0.96 | 0.53 |
| Ukraine | 1 | 45.45 | P | C | 2.13 | 1,449 | 15 | C | 7 | 7 | 0.97 | 0 | 0.58 | 0.37 |
| UK | 1 | 62.04 | A | C | 0.10 | 380 | 59 | E | 7 | 4 | 0.14 | 0 | 0.21 | 0.09 |
Explanation. The table lists SWDEF, population size (not considering territories outside Europe or with special status) in million people, the legal approach and its implementation (by initial letters), three rows related to ECtHR judgments (VP = violations per million people and years since accession to ECHR and 2012, and the raw data: total ECHR violations, years at CoE), ratification type, end-nodes (EN) of figures 2 and 3, two parameters of the ML model, and vulnerability indices.
Norbert Brunner
Mathematics, DIBB, University of Natural Resources and Life Sciences (BOKU)
Gregor Mendel Strasse 33, 1180 Wien, Austria
E-Mail: norbert.brunner@boku.ac.at.
Christof Tschohl
Research Institute AG & Co KG, Center for Digital Humanrights
Amundsen-Strasse 9, 1170 Wien, Austria
E-Mail: christof.tschohl@researchinstitute.at.
The Supporting Information is available for download here.
- 1 Hibbs, D.A. (1973). Mass Political Violence: A Cross-National Causal Analysis. Wiley, New York.
- 2 Brunner, N., Tschohl, C. (2013). Do Patterns of Treaty Ratifications Reveal Societal Preferences? Analysis of Twelve Council of Europe Conventions, in: Jusletter IT 20. Februar 2014 (Conference Proceedings to IRIS (Internationales RechtsInformatik Symposium in Salzburg) 2014). In addition the empirical data used are available in a Supporting Information for this paper. An S in the numbering of sections, tables and figures refers to it. The Supporting Information is available for download here.
- 3 Cole, W.M. (2011). Individuals v States: The Correlates of Human Rights Committee Rulings, 1979–2007. Social Science Research, 40, 985–1000.
- 4 This paper uses the term «factor» colloquially without reference to «factor analysis» (instead of which this paper applies principal component analysis).
- 5 Csete, J., Seshu, M.S. (2004). Still Underground: Searching for Progress in Realizing the Human Rights of Women in Prostitution. HIV/AIDS Policy & Law Review, 9, 8–13.
- 6 Vandepitte, J., Lyerla, R., Dallabetta, G., Crabbé, F., Alary, M., Buvé, A. (2006). Estimates of the Number of Female Sex Workers in Different Regions of the World. Sexually Transmitted Infections, 82, Suppl 3, 18–25.
- 7 Vanwesenbeeck, I. (2001). Another Decade of Social Scientific Work on Sex Work: A Review of Research 1990-2000. Annual Review of Sex Research, 12, 242–289.
- 8 Bennet, N. (2009). Sex Work: A Survey of Social, Philosophical and Human Rights Issues. International Journal of Green Economics, 3, 93–100.
- 9 UNAIDS (2006). International Guidelines on HIV/AIDS and Human Rights, Joint UN Programme on HIV/AIDS, Geneva.
- 10 ILO (2010). HIV & AIDS Recommendation R200, International Labour Organization, Geneva.
- 11 Hastie, T., Tibshirani, R., Friedman, J. (2011). The Elements of Statistical Learning: Data Mining, Inference and Prediction. Springer Series in Statistics, Heidelberg.
- 12 Breiman, L., Friedman, J., Olshen, R.A., Stone, C.J. (1984). Classification and Regression Trees. Wadsworth.
- 13 Segal, M.R., Bloch, D.A. (1989). A Comparison of Estimated Proportional Hazards Models and Regression Trees. Statistics in Medicine, 8, 539–550.
- 14 Hand, D.J., Mannila, H., Smyth, P. (2001). Principles of Data Mining. MIT Press, Boston.
- 15 Borda, M. (2011). Fundamentals in Information Theory and Coding. Springer, Berlin.
- 16 «Big data» applications divide the sample into a learning population, where the model is developed, and a test population, where it is verified. In the present context, this approach is not meaningful, as first, 47 countries is a comparatively small sample and second, these countries represent the whole investigated «population». Also, in commercial applications different misclassifications may have different costs; e.g. credit rating (refusing credits is less costly than accepting high risks).
- 17 Brunner, N., Starkl., M. (2004). Decision Aid Systems for Evaluating Sustainability: A Critical Survey. Environmental Impact Assessment Review, 24, 441–469.
- 18 This approach resembles the latent-variable approach to define an index in a probit-model. However, it is different, as it does not maximize the likelihood of the above system of inequalities, and it does not use probability distribution assumptions.
- 19 Components as defined by means of PCA, considered below, are yet another class of indices of vulnerability, which do not satisfy the condition of feasibility.
- 20 Casella, G., Berger, R.L. (2001). Statistical Inference. Pacific Growe.
- 21 Jolliffe, I.T. (2002). Principal Component Analysis. Springer Series in Statistics, Heidelberg.
- 22 Adler, N., Yazhemsky, E, Tarverdyan, R. (2010). A Framework to Measure the Relative Socio-Economic Performance of Developing Countries. Socio-Economic Planning Sciences, 44, 73–88.
- 23 Crago, A.L. (2009). Arrest the Violence – Human Rights Abuses against Sex-Workers in CEE/CA. SWAN and Open Society Foundation, Budapest.
- 24 ILO (2012). ILO Global Estimate of Forced Labor; Results and Methodology. International Labor Organization, Geneva.
- 25 Rape of SWs by police officers in points 4 and 5 strictly speaking would not count as HR violation, if perpetrators are punished and victims redressed. However, incidents which become known due to reports about prosecution of perpetrators are just the tip of an iceberg, indicating a culture, which perceives women in SW as lawless. Thus, there are also reports from countries of points 1 to 3 about the rape of SWs by police officers (e.g. Germany: Hannoversche Allgemeine of 9 March 2012).
- 26 Correlation compares vectors in dimension 47, the number of CoE countries. T-test shows that correlation coefficient is positive with 95% significance.
- 27 Microstates: Andorra, Iceland, Liechtenstein, Luxembourg, Malta, Monaco, San Marino
- 28 For the correlation between SWDEF and country size see also Figure 3 below.
- 29 PACE (2007). Prostitution – Which Stance to Take? Parliamentary Assembly of the Council of Europe, Recommendation 1815, Document 11352 of 9 July 2007.
- 30 Niemi, J. (2010). What We Talk About When We Talk About Buying Sex. Violence against Women, 16, 159–172. There Finland was classified as neo-abolitionist, although other than in Sweden also SWs are prosecuted.
- 31 SWFV (2012). Human Rights of Sex Workers in Europe. A Survey and Critical Analysis. Sex-Worker Forum of Vienna, www.sexworker.at.
- 32 UNO (2011). World Population Prospects. Department of Economic and Social Affairs, New York.
- 33 ECtHR (2012). Violations by Article and by State, 1959 to 2011. Registry, ECtHR, Strasbourg.
- 34 Cingranelli, D.L., Richards, D.L. (2013). The Human Rights Dataset, www.humanrightsdata.org.
- 35 Roberts, S.M., Wright, S., O’Neill, P. (2007). Good Governance in the Pacific? Ambivalence and Possibility. Geoforum, 38, 967–984.
- 36 This correlation might be spurious; c.f. Section S5 in the context of SWs’ HR situation.
- 37 All 11 countries with F1 < –0.683 are prohibitionist, as are 50% of 10 countries with –0.683 ≤ F 1 < –0.192. For intermediate –0.192 ≤ F1 < 0.508 no approach dominates, but amongst these 14 countries there is a concentration of the regulationist ones (5 of 8). Finally, 75% of the 12 countries with F1 ≥ 0.508 are abolitionist. Together with other components, more precise descriptions are possible.
- 38 France, Italy, Moldova and UK are conservative countries misclassified as liberal, and Estonia, Finland, Norway and San Marino are liberal countries misclassified as conservative.
- 39 Using CHAID, «ratification components» together with population size characterize SWDEF correctly for all, except one country. This supports the hypothesis of this paper that ratifications capture the societal preferences, which also govern policies towards SW. However, the tree models of section 7 are preferred, as the empirical meaning of components is difficult to interpret.
- 40 If VP is classified in three classes (high to low) as in Figure 3, «ratification components» explain 85% of VP, using CHAID.
- 41 The authors tested other tree models, too. For instance, there is a manually generated tree (3 misclassifications) with only two criteria: The first split is by torture (threshold 0.35). If torture is low, the next split asks for high violations of speech & press (threshold 0.45), if torture is high, the next split asks for any violation of speech & press (threshold 0.05).
- 42 By Section S2, Finland is a borderline case for SWDEF = 1. Node 4 contains also the Netherlands and Norway, which are borderline cases for SWDEF = 0.
- 43 The other countries are Estonia and Portugal. Estonia is a borderline case for SWDEF = 0. If it is reclassified as SWDEF = 1, then end-node 6 will switch to SWDEF = 1 and now Portugal will be misclassified.
- 44 They fail to distinguish Portugal (SWDEF = 0) from Belgium, Czech Republic, Finland and Poland (SWDEF = 1).
- 45 Similarly, there exists an index for the Figure 3 model, which identifies SWDED = 0/1 by means of a weighted sum of ratification data (including EC-membership), population size (in million persons) and VP: The positive and negative weights for the CoE treaties are 1.79, 5.87, 2.19, –0.44, –1.44, 2.07, –0.73, –2.74, –2.82, –2.71, 4.91, 1.61 (order of Table S5) and the weights of EC-membership, population size and VP are 0.99, 0.15, and 0.1. If the sum is below the threshold 10.05, then SWDEF = 0, otherwise SWDEF = 1.
- 46 The distance of the country index value closest to the threshold from the threshold is 3/343 x 0.0087, which is about 6% of the applicable threshold 0.149 (Table 4, row #3).
- 47 If Finland, a borderline case of SWDEF = 1 (Section S2), is reclassified, the peculiarity will vanish.
- 48 The exceptions are Iceland (a micro-state), and the Netherlands (a borderline case).
- 49 For instance, in Mexico (tree model: node 7) national law prohibits forced HIV testing of SWs, as it discriminates against women, but communal ordinances may overrule it (see government response to UNGASS Country Progress Report 2010).
- 50 These are 13 European countries and Australia, Japan, Marshall Islands, Micronesia, Nauru, New Zealand, and Palau.
- 51 Taking into account that Palau is a borderline case, if at most 28% of countries in the world have SWDEF = 0 (rate of Europe), then with 97.7% chance amongst five countries there will be at least two with SWDEF = 1.
- 52 However, due to small sample size significance is low: The observation that all seven countries mentioned in this paragraph have SWDEF = 1 is 90% significant (assuming 28% countries with SWDEF = 0).
- 53 Kalikov, J. (2002). Survey of Sex Workers in the Baltic States. AIDS Information and Support Center, Tallinn, Estonia.
- 54 The models are not intended to support country rankings and such rankings would depend strongly on the chosen index. For instance, with respect to the feasible CIRI-type vulnerability index, the three worst SW destinations would be Azerbaijan, Russia and Turkey, owing to their poor overall HR performance.
- 55 Bárd, K. (2012). Menschenrechte und richterliche Unabhängigkeit in den Ländern des Donauraumes. Discussion Paper, 3/12, Institute for European Integration, Europa-Kolleg, Hamburg.
- 56 Here country size, VP, and ratification type are considered, resulting in 45 = 3x3x5 classes.
- 57 By Section S2, Norway and the Netherlands are borderline cases for SWDEF = 0.
- 58 This uses Milton Friedman’s non-parametric test at 95% level of significance, followed by Nemenyi’s test for pair-wise comparisons at 99.5% confidence level to take care of spurious significances due to multiple comparisons. Non-parametric tests are used, as asymptotic normality of ML estimates is not guaranteed (e.g. the boundary value k = 0 is reached for more than 1/3 of simulations).


