1.
Introduction ^
This paper seeks to introduce contract/legal rule visualization to a wider audience. While recent research has started to build evidence that contracts can be made faster to read and clearer through visualization [Passera, 2012; Passera et al., 2013], the practical issue of who would produce such visualizations has remained open, calling for either the development of new visual communication skills for contract drafters, new ways to collaborate with designers, or the need for new drafting tools. The latter is the approach we explore in this paper, as we wish to demonstrate the conceptual and practical value of automated tools that can help drafters to make the meaning of their contracts clearer.
The scenario of use we concentrate on is commercial business-to-business (B2B) contracts, with sales and purchasing managers as the main expected user groups. In B2B contracts many clauses focus on business deliverables, processes and outcomes, rather than on legal terms. The expertise of business managers is thus vital when drafting such clauses, as contracts can function as helpful planning mechanisms [Macneil & Gudel, 2001] and as blueprints for performance [e.g., DiMatteo, Siedel & Haapio, 2012]. In this paper we present three demos of automated contract tools (term and termination; payment terms; and liquidated damages for delay in delivery) that can help drafters – managers as well as lawyers – produce contract texts and visualizations with minimum effort, just by focusing on clarifying the operative details of the deal.
2.
Contract Visualization and Automation: the Benefits ^
B2B contracts are complex. Their production involves several departments and diverse groups of experts. Despite best efforts, sharing meanings and understanding across different professional communities is a challenge: in Von Hippel’s words [1994], knowledge is «sticky» and difficult to transfer, partly because it is tacit, partly because it is not encoded in a way that subjects external to a specific community can readily use. The same phenomenon is addressed by Eppler [2004], when he identifies «chasms of knowledge» existing between experts and managers and suggests that they can be bridged only through deliberate, interactive communication activities aimed at conveying and co-constructing insights, assessments, experiences and skills through verbal or non-verbal means.
The way contracts are mostly written and presented ignores the fact that lawyers are not their only readers and users and that legal expertise is only one of the types of expertise needed to draft and implement a successful deal and relationship. While we still need enforceable legal protection in contracts, we also need to make contracts functional in all everyday business-as-usual implementation scenarios outside of the courtroom. Integrating visualization into contract text allows to open up their meaning to all those for whom «legalese» is challenging, increasing the odds of different actors engaging with the text and understanding it. This not only acknowledges the fact that different people have different preferred cognitive styles to process information [Blazhenkova & Kozhevnikov, 2009], but also builds on specific advantageous peculiarities of visual communication. Yet producing visual communication can be a challenge. In the following, we introduce the rationale upon which we build our case in favor of contract visualization and the automation of drafting practices.
2.1.
Benefits of Visualization ^
There are many benefits to visualization, by which we mean the display of information in a visual format, thus adding infographics, charts, icons or images to supplement text. Firstly, visualization helps different parties to articulate tacit assumptions, as by nature it requires an explicit encoding that makes abstract concepts easier to grasp [Kirsch, 2010]. The different mental models of different parties are made into shareable, externalized objects for thought, which can be compared, discussed and aligned. Secondly, integrating texts with visualizations distributes the cognitive load on different information processing systems, preventing information overload [Keller & Grimm, 2005]. Studies show how the visual display of information supports better understanding and memorization in comparison to plain prose [Wright & Reid, 1973] and how the way information is designed affects decision-making [Wright, 2009] and subjective perception of how usable an interface is [Tractinsky, Katz, & Ikar, 2000]. Thirdly, providing visual structure and visual cues supports readers in their reading strategies, reducing the chances of misinterpretation, as paralanguage (e.g. voice stresses and modulation, body language) does in spoken language [Waller, 1987].
Visualization can play an important role in contracting, as it is crucial for the parties to avoid misunderstandings and inadvertent non-compliance. This, however, has to be seen as an ongoing, common sensemaking process between the parties, starting already at the negotiation stage. By using visualizations the parties can, for instance, better illustrate their expectations on each others responsibilities during the pre-award phase, fostering mutual trust and commitment [Haddad, 2013]. Contract visualization can be seen as a way to implement a proactive approach to contracting [Siedel & Haapio, 2010; Haapio, 2013], as it not only aims to prevent disputes and litigation, but also to enhance the likelihood of successful business outcomes and a mutually beneficial relationship for both parties.
2.2.
Benefits of Automation ^
Document automation has a significant history and usage in the legal field, finding expression particularly in automated document assembly. Lauritsen [1998] describes the basic features of then available document assembly software. The essential feature of these systems is their ability to provide means for input of data, storage of and output of contract variables such as for example parties, pricing or alternative contract provisions automatically generated on the basis of provided facts. Systems range from simple macros embedded in word processing packages to complex commercial products backed by databases and logical rules.
The benefits of such systems is confirmed by their significant adoption by the legal industry. The survey of technology use by the International Legal Technology Association [ILTA, 2013] finds for example that 38% of law firms surveyed used document assembly software. 76% of firms reported using templating or macro systems (which represent simpler document automation solutions). The survey represented 494 firms and 88000 lawyers. In their 2011 survey [ILTA, 2011] of 54 in-house law departments covering a broad range of industries ILTA notes that 70% use Microsoft Word as their document assembly software, with specialised document assembly programs coming second and third. Other sources report that many corporations have moved from manual drafting to automated contract assembly and developed their own computer-based drafting systems [Adams, 2009; Quinn & Adams, 2007]. Interestingly in 2007, Lauritsen [2007] notes that as yet only the most elementary visualization interfaces had been tapped.
3.
Demos of Automated Tools for Contract Visualization ^
All demos can be tested here:
http://cs.anu.edu.au/people/Michael.Curtotti/visualcontracting/
3.1.
Term and Termination ^
This first automated tool builds on previous examples showing how duration and termination of agreements can be easily visualized through timelines [Passera, Haapio & Barton, 2013; Passera & Haapio, 2011]. Critical events, such as the start and the end of the agreement, as well as deadlines for renewing or terminating the agreement, are given visual relevance, being marked as «milestones» along the timeline (Figure 1). Different colours are used to create visual structure, as a change in colour signifies a change in meaning (e.g. in Figure 1, the black line represents the minimum duration of the agreement, during which it is not possible to terminate it, while the red line represents the period during which termination is possible, with a notice period). The data needed to create the text and the visualization is provided through a simple and intuitive interface (Figure 2), which prompts the user to think about the duration in concrete terms, through simple questions.
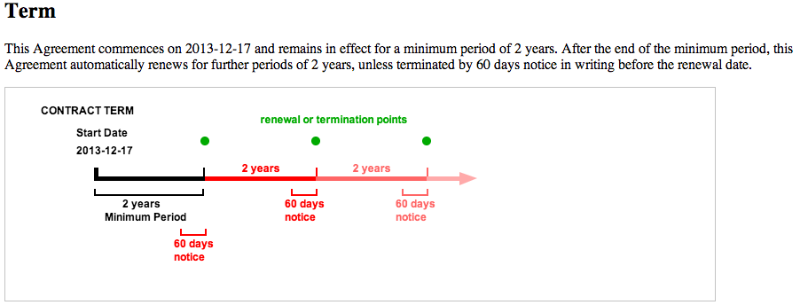
Figure 1: Timeline visualization showing the term and termination (along with renewal points) of the agreement

Figure 2: Input window of the above timeline visualization showing what information the user is asked for
3.2.
Payment ^
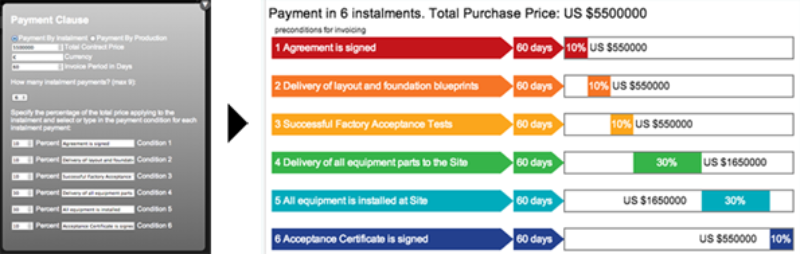
Figure 3: Input window and visualization of a payment clause: payment due in 6 instalments

Figure 4: Input window and visualization of a production-based payment clause. The visualization shows how the price and payment are affected by bonuses for exceeding or penalties for not meeting agreed production levels
3.3.
Liquidated Damages for Delay in Delivery ^
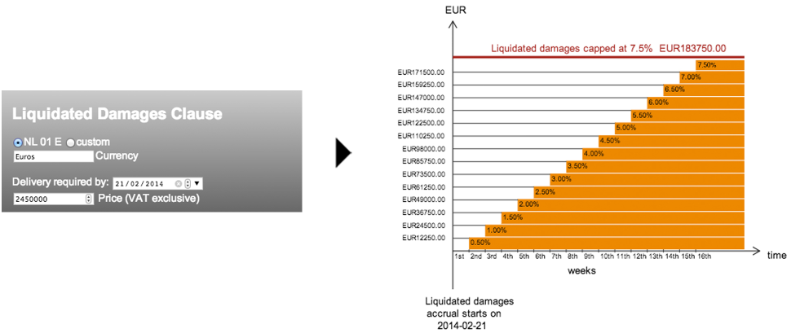
Figure 5: Visualization of the liquidated damages clause in NL 01 General Conditions1
4.
Discussion and Conclusions ^
From the demo users’ perspective, with the use of automated tools, contract drafting becomes an interactive activity, focused on prefiguring and thinking what the different clauses actually mean and how to implement them in practice. When the other party is involved in discussing and editing the visualizations, a process of true «trialogic learning» can develop, as the parties co-create and shape their common understanding by interacting and manipulating the visualization as a shared object of activity [Paavola & Hakkarainen, 2005]. This encourages interaction, and, at the same time, opens up a possibility of systematically designing tools, templates, and processes that guide the parties towards the best outcomes of a negotiation.
5.
Acknowledgements ^
6.
References ^
Adams, Kenneth A., Retooling your contract process for the downturn. New York Law Journal, February 19. http://www.koncision.com/wp-content/uploads/2011/05/nylj-retooling.pdf last accessed 28 December 2013 (2009).
Blazhenkova, Olesya/Kozhevnikov, Maria, The new object-spatial-verbal cognitive style model: Theory and measurement. Applied Cognitive Psychology 23, pp. 638–663 (2009).
DiMatteo, Larry/Siedel, George/ Haapio, Helena, Strategic contracting: Examining the business-legal interface. In G. Berger-Walliser & K. Østergaard (Eds.), Proactive Law in a Business Environment (pp. 59–106). Copenhagen, Denmark: DJOF Publishing (2012).
Eppler, Martin, Knowledge Communication Problems between Experts and Managers. An Analysis of Knowledge Transfer in Decision Processes, ICA Working Paper #1/2004, University of Lugano, Lugano (2004).
Haapio, Helena, Next Generation Contracts: A Paradigm Shift. PhD dissertation. Lexpert Ltd, Helsinki (2013).
Haddad, Said, Integration of Law and Contract Management – Applying Contract Visualization, In Proceedings of the IACCM Academic Forum on Contract and Commercial Management 2013, Phoenix, pp. 52-73 (2013).
International Legal Technology Association (ILTA), 2013 Technology Survey – Analysis and Results, http://www.iltanet.org/Downloads/2013-Tech-Survey.pdf last accessed 28 December 2013 (2013).
International Legal Technology Association (ILTA), 2011 Law Department Technology Survey – Analysis and Results, http://www.iltanet.org/MainMenuCategory/Publications/WhitePapersandSurveys/2011-Law-Department-Technology-Survey.pdf last accessed 30 December 2013 (2011).
Keller, Tanja/Grimm Matthias, The Impact of Dimensionality and Color Coding of Information Visualizations on Knowledge Acquisition. In S.-O. Tergan & T. Keller (Eds.), Knowledge and Information Visualization: Searching for Synergies, pp. 167–184, Heidelberg, Germany: Springer (2005).
Kirsh, David, Thinking with external representations, AI & Society, 25, pp. 441–454 (2010).
Lauritsen, Marc, Current Frontiers in Legal Drafting Systems. In Proceedings of the 11th International Conference on AI and Law. (2007).
Lauritsen, Marc/Soudakoff, Alan, Power Tools for Document Preparation. http://www.capstonepractice.com/amlaw6.pdf last accessed 28 December 2013 (1998).
Macneil, Ian/Gudel, Paul, Contracts—Exchange transactions and relations. Cases and materials. (3rd ed.). New York, NY: Foundation Press (2010).
Paavola, Sami/Hakkarainen, Kai, The Knowledge Creation Metaphor – An Emergent Epistemological Approach to Learning, Science & Education, 14, pp. 535-557 (2005).
Passera, Stefania, Enhancing Contract Usability and User Experience Through Visualization – An Experimental Evaluation. In Proceedings of the 16th International Conference on Information Visualisation, IV2012, Montpellier. doi: 10.1109/IV.2012.69 (2012).
Passera, Stefania/Haapio, Helena, Facilitating Collaboration Through Contract Visualization and Modularization. In Proceedings of the 29th annual conference of the European Association of Cognitive Ergonomics ECCE, Rostock. doi: 10.1145/2074712.2074724 (2011).
Passera, Stefania/Haapio, Helena/Barton, Thomas, Innovating Contract Practices: Merging Contract Design with Information Design. Proceedings of the IACCM Academic Forum on Contract and Commercial Management 2013, Phoenix, pp. 29-51 (2013).
Passera, Stefania/Pohjonen, Soile/Koskelainen, Katja/Anttila, Suvi, User-friendly Contracting Tools – A Visual Guide to Facilitate Public Procurement Contracting. In Proceedings of the IACCM Academic Forum on Contract and Commercial Management 2013, Phoenix, pp. 74-94 (2013).
Quinn, Brian C./Adams Kenneth A., Transitioning your contract process from the artistic to the industrial. ACC Docket, Vol. 25, No. 10, pp. 61–72. http://adamsdrafting.com/downloads/Quinn.Adams.ACCDocket.Dec07.pdf last accessed 28 December 2013 (2007).
Siedel, George J. & Haapio, Helena, Using Proactive Law for Competitive Advantage. American Business Law Journal, Vol. 47, Issue 4, Winter, pp. 641–686 (2010).
Tractinsky, Noam/Shoval-Katz, A./Ikar, D., What is beautiful is usable, Interacting with Computers 13, pp. 127–145 (2000).
Von Hippel, Eric, «Sticky Information» and the Locus of Problem Solving: Implications for Innovation. Management Science, 40(4), pp 429-439 (1994).
Waller, Robert, Typography and Reading Strategy, in B Britton & S Glynn (eds.), Executive control processes in reading, Hillsdale, NJ: Lawrence Erlbaum Associates (1987).
Wright, Patricia, What if …? Designing tools to help the public make difficult decisions, Information Design Journal, 17(3), pp. 202-210 (2009).
Wright, Patricia/Reid, Fraser, Written Information: Some Alternatives To Prose For Expressing the Outcomes of Complex Contingencies, Journal of Applied Psychology, 57(2), pp. 160-166 (1973).
Stefania Passera
PhD Researcher, Aalto University School of Science, Department of Industrial Management and Engineering
Betonimiehenkuja 5C, 02150, Espoo, FI
stefania.passera@aalto.fi; http://legaldesignjam.com
Helena Haapio
Business Law Teacher & Postdoctoral Researcher, University of Vaasa / International Contract Counsel, Lexpert Ltd
Pohjoisranta 20, 00170 Helsinki, FI
Helena.Haapio@lexpert.com; http://www.lexpert.com
Michael Curtotti
PhD Researcher, Australian National University, Research School of Computer Science, Legal Counsel, ANU Students» Assocation & ANU Postgraduate and Research Students» Association
Building 17a Student Facilities Building, Union Court, Australian National University, ACTON, ACT 0200, Australia
Michael.Curtotti@anu.edu.au
- 1 According to NL01 General Conditions, liquidated damages are payable at a rate of 0.5% of the agreed price for each complete week of delay and shall not exceed 7.5%. In our visual example, we chose not to show what happens if the maximum liquidated damages are reached and the goods are still not delivered. Then the Buyer may, following an agreed process, terminate the contract and claim damages for the loss that exceeds the maximum liquidated damages, up to an additional 7.5% of the price. In these General Conditions, all other claims in respect of the Seller’s delay are excluded, except, however, where the Seller has been guilty of gross negligence.


