1.
Introduction ^
Quality, innovation and technology are one of the most important factors for a company to stay competitive, especially in today’s economic environment, where markets, technologies and processes are changing fast. Business requirements and related processes will change based on future technologies.1 Today’s complex and highly automated business processes require the right people with the right skills at the right place, as data and related information are a major part of companies’ future competitive advantages.2 Unqualified resources cause lot of efforts within organizations as well as limitations in innovation, research and technology.3
A transformation towards end-to-end business process service delivery models is required considering important factors like security.4 Questions, such as,
- how markets and business requirements will change or
- if today’s services will also be required in the future or
- in which strategic direction the organization will develop
are difficult to answer as there are too many assumptions. From technology and process point of view predictions are a little bit easier, as there are facts and roadmaps existing. In the context of digitalization, internet of things (IoT) and industry 4.0, information technology (IT) becomes a more and more integrative part of core business processes.5 One major success factor are the resources operating the services independently of companies IT sourcing model.6 The difficulty lies within an objective assessment of the IT service quality as well as the identification of qualified resources.7 This paper compared – based on a real case example – the major differences of two suppliers as part of the supplier selection and evaluation process, with the goal to identify objective IT service quality indicators, hidden cost drivers, proper service level agreements (SLAs) as well as further critical success factors. Therefore a metadata analysis of communication items of the IT service delivery process has been performed.
2.
Comparison of supplier characteristics ^
Nowadays literature describes the importance of several different supplier evaluation criteria, where quality is still one of the most important factors. 8 The expectation of service quality is determined by factors such as recommendations, personal needs and experiences. Parasuraman, Zeithaml and Berry9 described in their SERVQUAL model ten (mainly subjective) determinants that may influence how customers experience services and – if not fulfilled – might result in a gap between experienced and expected service quality and related customer satisfaction.10 In most of the cases such subjective measures are assessed based on surveys, with the challenge to avoid low participation rates and bad data quality, which makes an objective assessment of service quality difficult.
- Service delivery model: capacity service vs. managed service (partially).
- Language of services changed to pure English.
- Flexibility: ability to short term adjust scope, resources and delivery times.
- Service delivery location: on-site, which makes tracking of communication efforts more difficult vs. nearshore, which has direct impact on the collaboration and communication between the service provider and the customer.
- Required skills and process know how: a temporary factor considering that over a certain period of time the new supplier will have sufficient company specific end-to-end business process expertise. This is depending on a stable resource situation to avoid continuous efforts for knowledge transfer.
- Resources being able to cover multiple required skills: This as a temporary factor, as resources will reach a sufficient level of knowledge after a certain period. This is also depending on a stable resource situation to avoid continuous efforts for knowledge transfer. Therefore, the volume of the scope has to be big enough to allow the service provider building up sufficient backup resources.
- Employee turnover
- Costs
- Company size
- Is it possible to identify criteria affecting the IT service quality?
- Is it possible to identify a combination of criteria causing difficulties in terms of qualitative IT service delivery?
- Is it possible to build an (automatic) SLA configuration tool creating best-fit SLAs and KPIs depending on specific supplier criteria?
- Is it possible to include related information into an automated decision support system that will make use of domain expertise and historical data of suppliers to reduce supplier evaluation costs? 11
- Is it possible to optimize service transition costs and time?
- How to interpret data considering those differences?
3.
Where to get the data from? – a metadata analysis of communication items created during the IT service delivery process ^
Employees spend a lot of time answering emails, participating meetings and phone calls during the IT service delivery process. A proper documentation of the business processes as well as the incident resolution process in terms of number and content are important quality factors and ensure independency from certain suppliers. The hypothesis is that if many communication items (e.g. emails, communication items within an incident management tool, etc.) for a specific scope of work exist over a longer period, indicates missing knowledge and skills. This leads to bad quality, additional effort as well as dissatisfaction on the customer’s side. Due to legal requirements and compliance procedures, the customer has to evaluate and – in case of successful service delivery – provide the necessary approvals, which requires qualified internal resources.
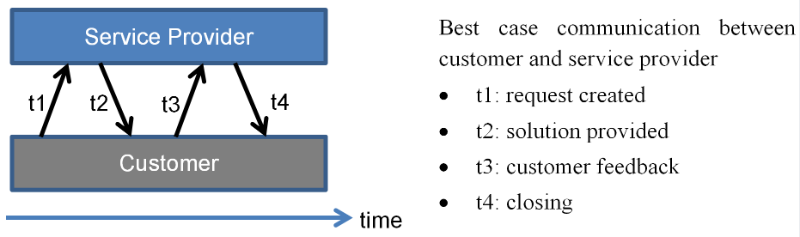
Figure 1: Communication between customer and service provider

The data of this example is based on records of an incident management tool between 2010 and 2016 for a specific area to ensure comparability of SoW. Year 2014 has not been considered as this was the year of the service transition from supplier 1 to supplier 2. Over the years 712 incidents in average were handled by external suppliers for this specific SoW – see Figure 2.
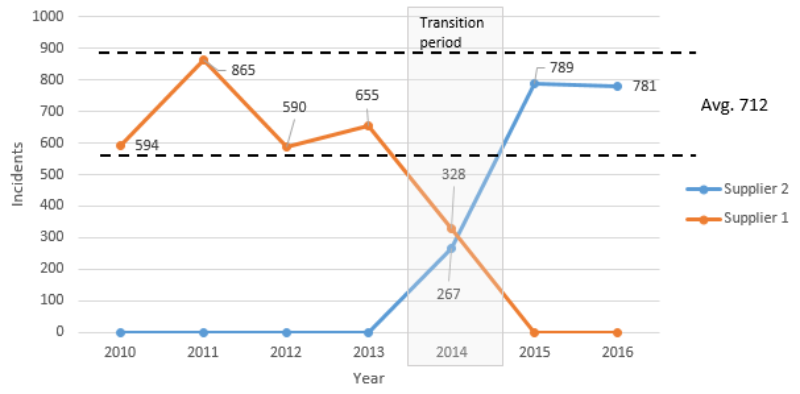
Figure 2: Incidents per year handled by external suppliers for specific SoW
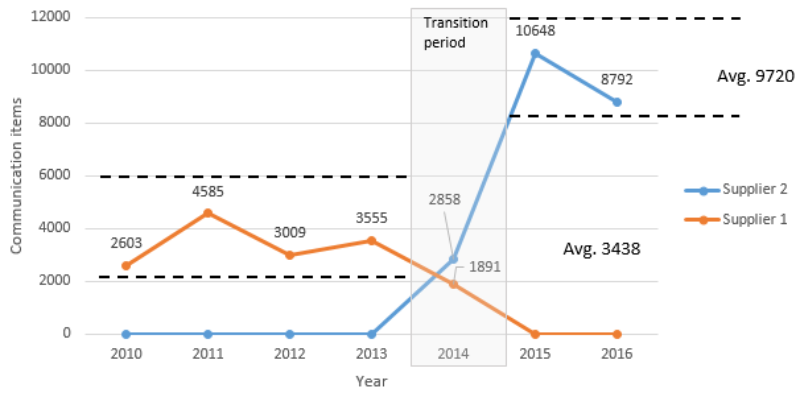
Figure 3: Yearly incident related communication items exchanged with externals suppliers
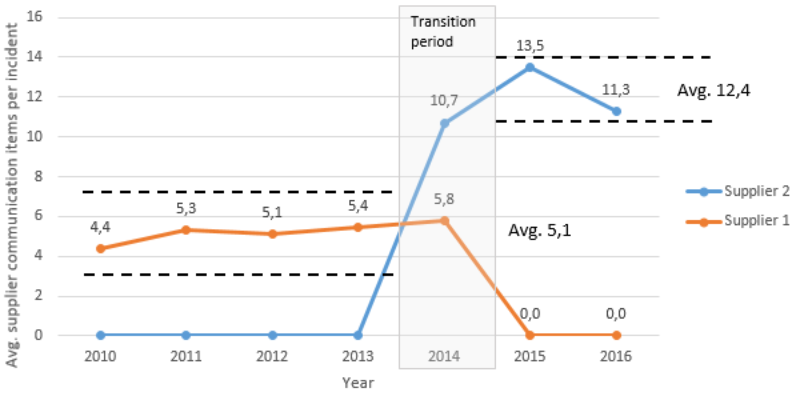
Figure 4: Yearly average supplier communication items per incident
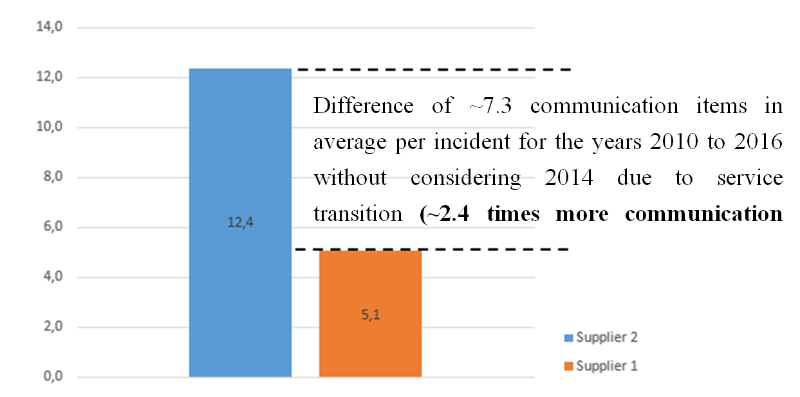
Figure 5: Average supplier communication items per incident (data out of incident management tool)
Assuming a time effort of 5 minutes per communication item results in ~36 minutes (7.3 x 5) more communication effort for every incident handled by supplier 2 compared to supplier 1. For instance using the yearly average of 712 incidents from Figure 2 will result in ~435 hours more communication effort ((712 x 36) / 60) when using supplier 2. Multiplying this effort with an hourly rate will raise the question if the service price of supplier 2 is still at optimum? As there was a change from a capacity based service model to a partially managed service model the interpretation of the results has to be done carefully, as not recorded communication items – due to direct verbal communication – might influence the result. The question of further research will also be how much will be the difference when just changing a supplier without also changing the operating model (e.g. compare managed service with another managed service supplier for the same scope)? The resulting opportunity costs could be used for other value adding activities (e.g. research and innovation).
This approach also allows a direct objective comparison of resources. Resources with high average communication items per incident over a longer period of time for the same SoW are most probably not qualified enough, as this is an indication of missing know-how. Figure 6 shows a resource comparison of supplier 2.
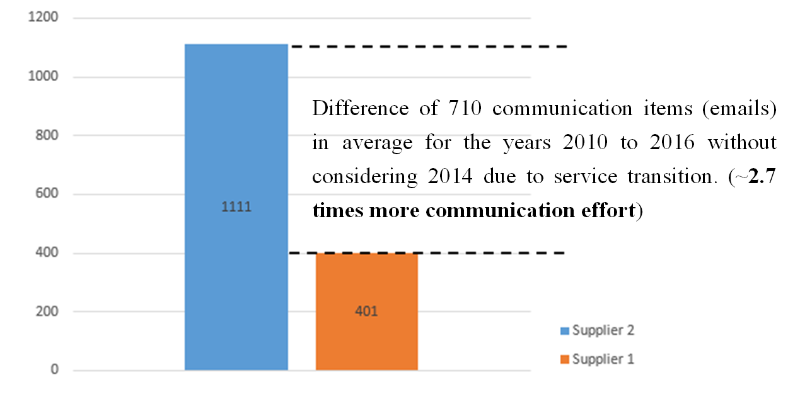
Figure 6: Yearly average communication items per incident per resource (sample resources of supplier 2)
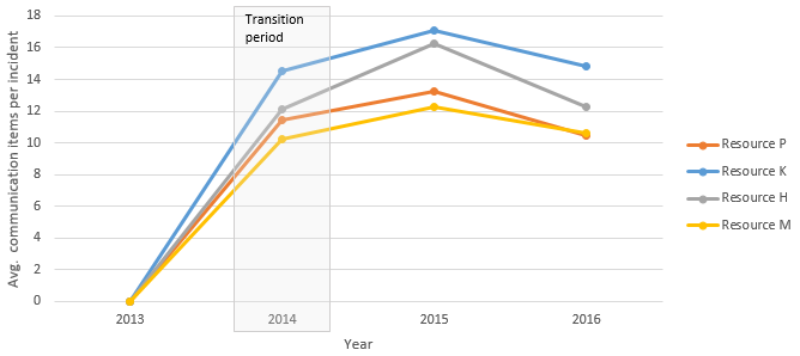
Figure 7: Average yearly supplier email communication (data out of email conversations)
The approach can be enhanced with further parameters to get an even more detailed picture and enables to drill down to specific cases. To optimize the results machine learning algorithms can be used. The following example shows the communication efforts for a detailed case including phone calls and calendar (meeting) data:

| Data: | Case 1 | Unit of measure |
| Communication items – number of mails (#Mails): | 25 | quantity |
| Estimated time effort per communication item: | 5 | min |
| Number of phone calls (#PhoneCalls): | 6 | quantity |
| Estimated average time to prepare for a phone call: | 15 | min |
| Average duration of phone calls: | 30 | min |
| Number of meetings (#Meetings): | 3 | quantity |
| Estimated average time to prepare for a meeting (without time for traveling and slide preparation): | 30 | min |
| Average duration of meetings: | 60 | min |
| Communication effort: | 665 | min |
| Communication effort: | 11 | h |
Table 1: Calculation of communication effort of detailed case incl. mails, phone calls and meetings
4.
Conclusion ^
5.
Outlook ^
6.
References ^
Abdolshah, A Review of Quality Criteria Supporting Supplier Selection, Journal of Quality and Reliability Engineering, Article ID 621073, 2013.
Aubert/Rivarda/Patrya, A transaction cost model of IT outsourcing, 2003.
Bharadwaj, A Resource-Based Perspective on Information Technology Capability and Firm Performance: An Empirical Investigation, MIS Quarterly, Vol. 24, No. 1, pp. 169–196, 2000.
Brody/Pureswaran, The next digital gold rush: how the internet of things will create liquid, transparent markets, Strategy & Leadership, Vol. 43 Issue: 1, pp. 36–41, 2015.
Cater-Steel/Lepmets, Measuring IT Service Quality: Evaluation of IT Service Quality Measurement Framework in Industry, Journal of Service Science Research, 2014.
Cleven/Mettler/Rohner/Winter, Healthcare quality innovation and performance through process orientation: Evidence from general hospitals in Switzerland, Institute of Information Management, University of St. Gallen, Switzerland, 2016.
Daugherty/Banerjee/Negm/Alter, Driving Unconventional Growth through the Industrial Internet of Things, Accenture technology, 2014.
Dickson, An Analysis of Vendor Selection Systems and Decisions, Journal of Purchasing, Vol. 2, No. 1, pp. 5-20, 1966.
Gallego, Review of existing methods, models and tools for supplier evaluation, Dissertation Linköpings University, Madrid, 2011.
Hartmann/Halecker, Management of Innovation in the Industrial Internet of Things, ISPIM Conference Proceedings, Manchester: The International Society for Professional Innovation Management, 2015.
Harvard Business Review, Internet of Things: Science Fiction or Business Fact?, 2014.
Kagermann/Wahlster/Helbig, Securing the future of German manufacturing industry: Recommendations for implementing the strategic initiative INDUSTRIE 4.0: Final report of the Industrie 4.0 Working Group, 2013.
Kohlbacher/Gruenwald, Process orientation: conceptualization and measurement, Business Process Management Journal Vol. 17 No. 2, pp. 267–283, 2011.
Kohlbacher/Reijers, The effects of process-oriented organizational design on firm performance, Business Pro-cess Management Journal Vol. 19 No. 2, pp. 245–262, 2013.
Lee/Bagheri/Kao, Recent Advances and Trends of Cyber-Physical Systems and Big Data Analytics in Industrial Informatics, IEEE Int. Conference on Industrial Informatics, 2014.
Lee D./Lee T./Lee S./Jeong/Eom, BestChoice: A Decision Support System for Supplier Selection in e-Marketplaces, Data Engineering Issues in E-Commerce and Services, Lecture Notes in Computer Science, vol. 4055, Springer, Berlin, Heidelberg, 2006.
Lockamy/McCormack, The development of a supply chain management process maturity model using the concepts of business process orientation, Supply Chain Management: An International Journal Volume 9 Number 4, pp. 272–278, 2004.
Mattern/Friedemann/Floerkemeier, From the Internet of Computers to the Internet of Things, ETH Zurich, 2016.
Mukherjee/Krishnendu, Supplier selection criteria and methods: past, present and future, International Journal of Operational Research, 2014.
Parasuraman/Zeithaml/Berry, A Conceptual Model of Service Quality and Its Implications for Future Research, Journal of Marketing, vol. 49, pp. 41–50, 1985.
Siponena/Baskervilleb/Kuivalainena, Integrating Security into Agile Development Methods, Proceedings of the 38th Hawaii International Conference on System Sciences, 2005.
Skrinjar/Bosilj-Vukssic/Indihar-Stemberger, The impact of business process orientation on financial and non-financial performance, Business Process Management, Journal Vol. 14 No. 5, pp. 738–754, 2008.
Sureshchandar/Rajendran/Anantharaman, The relationship between service quality and customer satisfaction – a factor specific approach, Journal of Services Marketing, vol. 16, pp. 363–379, 2002.
Tang/Pee/Iijima, The Effects Of Business Process Orientation On Innovation, 2012.
Turber/Vom Brocke/Gassmann/Fleisch, Designing Business Models in the Era of Internet of Things: Towards a Reference Framework, Book Advancing the Impact of Design Science: Moving from Theory to Practice, 2014.
Vermesan/Friess, Internet of Things: Converging Technologies for Smart Environments and Integrated Ecosystems, Aalborg, River Publishers, 2013.
Vital/Aubert, A Resource-Based Analysis of IT Sourcing, The DATA BASE for Advances in Information Systems, Vol. 33, No. 2, 2002.
Zope/Anand/Lokku, Reviewing Service Quality for IT Services Offerings: Observations in the light of Service Quality Models & Determinants, 2014.
- 1 Vermesan/Friess 2013; Mattern/Friedemann/Floerkemeier 2016.
- 2 Turber/Vom Brocke/Gassmann/Fleisch 2014; Brody/Pureswaran 2015, pp. 36–41; Harvard Business Review 2014.
- 3 Hartmann/Halecker 2015; Cleven/Mettler/Rohner/Winter 2016; Tang/Pee/Iijima 2012.
- 4 Skrinjar/Bosilj-Vukssic/Indihar-Stemberger 2008, pp. 738–754; Lockamy/McCormack 2004, pp. 272–278; Kohlbacher/Gruenwald 2011, pp. 267–283; Kohlbacher/Reijers 2013, pp. 245–262; Siponena/Baskervilleb/Kuivalainena 2005.
- 5 Kagermann/Wahlster/Helbig 2013; Lee/Bagheri/Kao 2014.
- 6 Aubert/Rivarda/Patrya 2003; Vital/Aubert 2002; Bharadwaj 2000, pp. 169–196.
- 7 Parasuraman/Zeithaml/Berry 1985, pp. 41–50; Zope/Anand/Lokku 2014; Cater-Steel/Lepmets 2014.
- 8 Gallego 2011; Dickson 1966, pp. 5–20; Abdolshah 2013; Mukherjee/Krishnendu 2014.
- 9 Parasuraman/Zeithaml/Berry 1985.
- 10 Sureshchandar/Rajendran/Anantharaman 2002, pp. 363–379.
- 11 Lee D./Lee T./Lee S./Jeong/Eom 2006.
- 12 Daugherty/Banerjee/Negm/Alter 2014.
- 13 Regulation (EU) 2016/679 or the European Parliament and of the Council of 27 April 2016 on the protection of natural persons with regard to the processing of personal data and on the free movement of such data, and repealing Directive 95/46/EC (General Data Protection Regulation), 2016.


